emooki
HomePrice mapTransactions
🇬🇧 English🇫🇷 Français🇩🇪 Deutsch🇪🇸 Español🇮🇹 Italiano

Real estate price map


Real estate price map in the Jura department.

Department 39
Jura

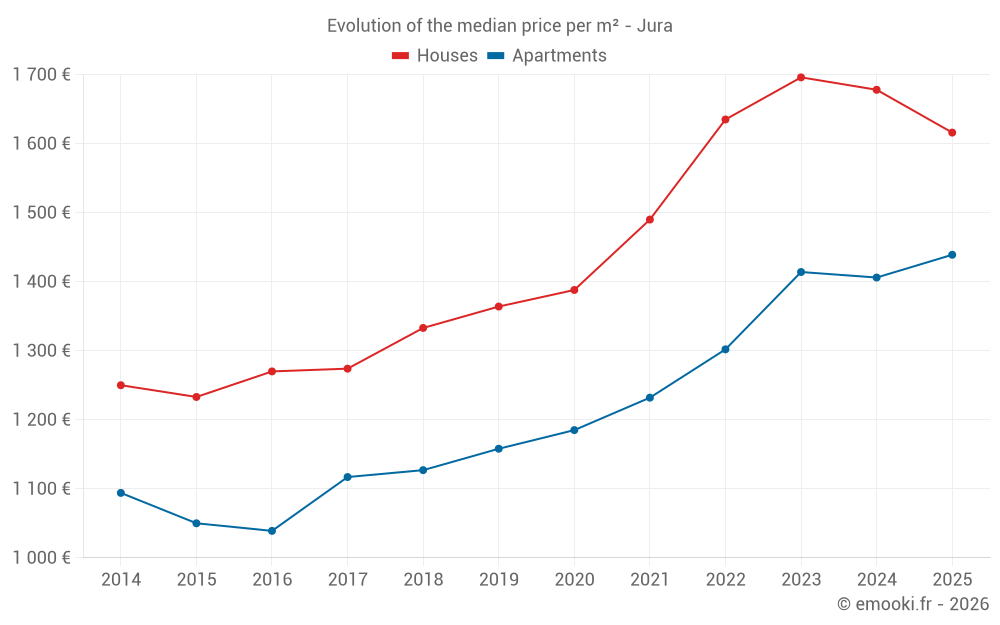
Median price of real estate
in the Jura department

HousesHouses
1 637 € /m²
1-23-45-67-89-10
Reliability 10/10
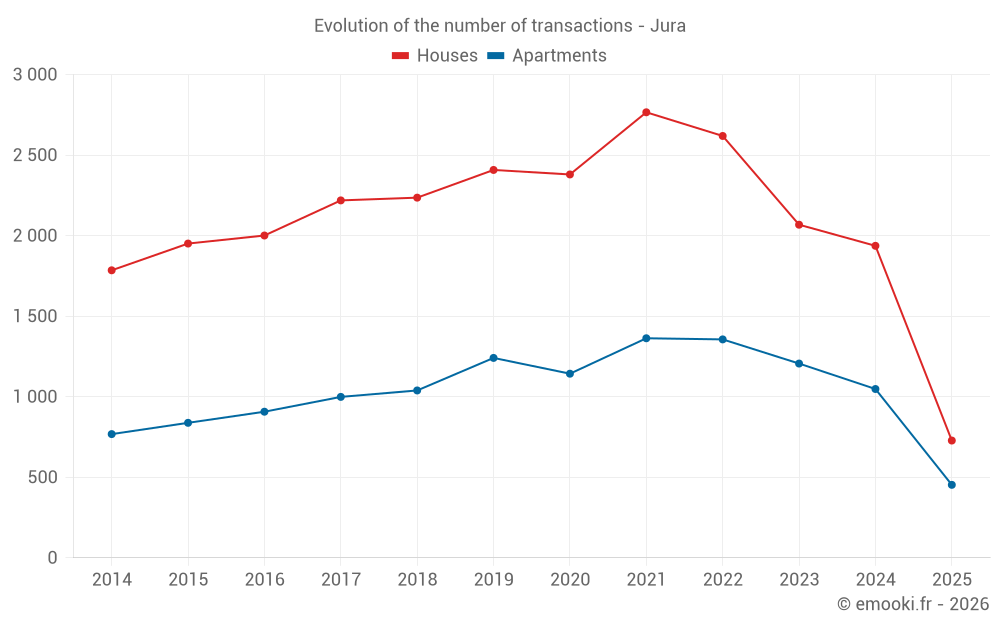
Median price on the 275 transactions of the last 3 months.
from 1 118 to
2 270 € /m²
60% of transactions from the 2nd to the 8th deciles.
ApartmentsApartments
1 440 € /m²
1-23-45-67-89-10
Reliability 10/10
Median price on the 174 transactions of the last 3 months.
from 872 to
2 310 € /m²
60% of transactions from the 2nd to the 8th deciles.
DwellingsDwellings
1 595 € /m²
1-23-45-67-89-10
Reliability 10/10
Median price on the 449 transactions of the last 3 months.
from 986 to
2 294 € /m²
60% of transactions from the 2nd to the 8th deciles.
HousesEvolution of the price per m² of houses since...
1 year
-3.7%
2 years
-4.7%
3 years
-1.2%
4 years
+8.5%
5 years
+16%
6 years
+18%
7 years
+21%
8 years
+27%
9 years
+27%
10 years
+31%
11 years
+29%
ApartmentsEvolution of the price per m² of apartments since...
1 year
+2.3%
2 years
+1.8%
3 years
+11%
4 years
+17%
5 years
+21%
6 years
+24%
7 years
+28%
8 years
+29%
9 years
+38%
10 years
+37%
11 years
+32%

Yearly evolution

Evolution of the median price per m²

Evolution of the number of transactions

Warning, last year incomplete. Projections made based on the proportions between semesters of the previous year at the departmental/national level and by type of property.

Yearly data

Descending order
Year
Houses
house
transactions
Houses
house
Price per m²
Apartments
apt.
transactions
Apartments
apt.
Price per m²
2025
728
1 616 €
453
1 439 €
2024
1 937
1 678 €
1 048
1 406 €
2023
2 068
1 696 €
1 206
1 414 €
2022
2 619
1 635 €
1 356
1 302 €
2021
2 766
1 490 €
1 363
1 232 €
2020
2 380
1 388 €
1 143
1 185 €
2019
2 408
1 364 €
1 241
1 158 €
2018
2 236
1 333 €
1 039
1 127 €
2017
2 219
1 274 €
999
1 117 €
2016
2 001
1 270 €
907
1 039 €
2015
1 951
1 233 €
838
1 050 €
2014
1 785
1 250 €
768
1 094 €

Analysis

Structure of prices per m²

Values of price percentiles per m² over the periods used for the estimated price of each type of property.

Structure of transaction amounts

Values of transaction amounts percentiles over the periods used for the estimated price of each type of property.

Transaction amounts and prices per m² by percentile

Ascending order
Percentile
Houses
house
Price per m²
Houses
house
Transaction amount
Apartments
apt.
Price per m²
Apartments
apt.
Transaction amount
10th percentile
610 €
65 000 €
607 €
52 290 €
20th percentile
1 118 €
104 K€
872 €
65 928 €
30th percentile
1 331 €
129 K€
1 066 €
81 900 €
40th percentile
1 468 €
150 K€
1 238 €
93 194 €
50th percentile
1 637 €
167 K€
1 440 €
104 K€
60th percentile
1 784 €
194 K€
1 732 €
127 K€
70th percentile
2 010 €
227 K€
1 974 €
140 K€
80th percentile
2 270 €
257 K€
2 310 €
170 K€
90th percentile
2 572 €
315 K€
3 193 €
218 K€

Quarterly evolution

Evolution of the median price per m²

Evolution of the number of transactions

Quarterly data

Descending order
Quarter
Houses
house
transactions
Houses
house
Price per m²
Apartments
apt.
transactions
Apartments
apt.
Price per m²
2025 Q2
275
1 637 €
174
1 440 €
2025 Q1
453
1 586 €
279
1 439 €
2024 Q4
554
1 679 €
293
1 462 €
2024 Q3
566
1 720 €
274
1 368 €
2024 Q2
427
1 629 €
250
1 387 €
2024 Q1
390
1 671 €
231
1 419 €
2023 Q4
510
1 672 €
331
1 360 €
2023 Q3
567
1 739 €
294
1 468 €
2023 Q2
505
1 762 €
312
1 400 €
2023 Q1
486
1 600 €
269
1 429 €
2022 Q4
647
1 678 €
355
1 310 €
2022 Q3
755
1 686 €
335
1 392 €
2022 Q2
668
1 520 €
360
1 266 €
2022 Q1
549
1 590 €
306
1 220 €
2021 Q4
689
1 513 €
363
1 311 €
2021 Q3
812
1 518 €
339
1 231 €
2021 Q2
689
1 500 €
387
1 180 €
2021 Q1
576
1 394 €
274
1 252 €
2020 Q4
743
1 410 €
314
1 214 €
2020 Q3
673
1 418 €
276
1 148 €
2020 Q2
486
1 416 €
290
1 188 €
2020 Q1
478
1 291 €
263
1 190 €
2019 Q4
671
1 354 €
359
1 181 €
2019 Q3
672
1 450 €
328
1 185 €
2019 Q2
563
1 310 €
298
1 128 €
2019 Q1
502
1 307 €
256
1 098 €
2018 Q4
596
1 375 €
269
1 175 €
2018 Q3
633
1 398 €
253
1 106 €
2018 Q2
507
1 325 €
255
1 115 €
2018 Q1
500
1 230 €
262
1 106 €
2017 Q4
585
1 290 €
267
1 130 €
2017 Q3
638
1 349 €
236
1 140 €
2017 Q2
508
1 230 €
253
1 075 €
2017 Q1
488
1 234 €
243
1 079 €
2016 Q4
561
1 230 €
238
1 051 €
2016 Q3
576
1 309 €
248
1 057 €
2016 Q2
473
1 215 €
241
1 042 €
2016 Q1
391
1 313 €
180
1 012 €
2015 Q4
536
1 178 €
224
960 €
2015 Q3
588
1 314 €
231
1 040 €
2015 Q2
457
1 228 €
207
1 035 €
2015 Q1
370
1 166 €
176
1 134 €
2014 Q4
464
1 248 €
198
1 115 €
2014 Q3
524
1 304 €
184
1 087 €
2014 Q2
435
1 234 €
202
1 118 €
2014 Q1
362
1 222 €
184
1 052 €

Jura (39)

Most expensive cities

City
name
Descending orderHouses
house
Price per m²
4 238 €
3 961 €
3 877 €
3 513 €
3 351 €
3 178 €
3 007 €
2 996 €
2 918 €
2 846 €
City
name
Descending orderApartments
apt.
Price per m²
3 853 €
3 456 €
2 982 €
2 732 €
2 583 €
2 511 €
2 405 €
2 361 €
2 286 €
2 276 €

Least expensive cities

City
name
Ascending orderHouses
house
Price per m²
381 €
417 €
462 €
466 €
539 €
544 €
546 €
584 €
597 €
628 €
City
name
Ascending orderApartments
apt.
Price per m²
73 €
86 €
168 €
195 €
195 €
200 €
215 €
222 €
237 €
240 €