emooki
HomePrice mapTransactions
🇬🇧 English🇫🇷 Français🇩🇪 Deutsch🇪🇸 Español🇮🇹 Italiano

Real estate price map


Real estate price map in the municipality of Cesancey, choose a section to see transactions by parcel.

Jura (39)

Cesancey - Real estate price m²

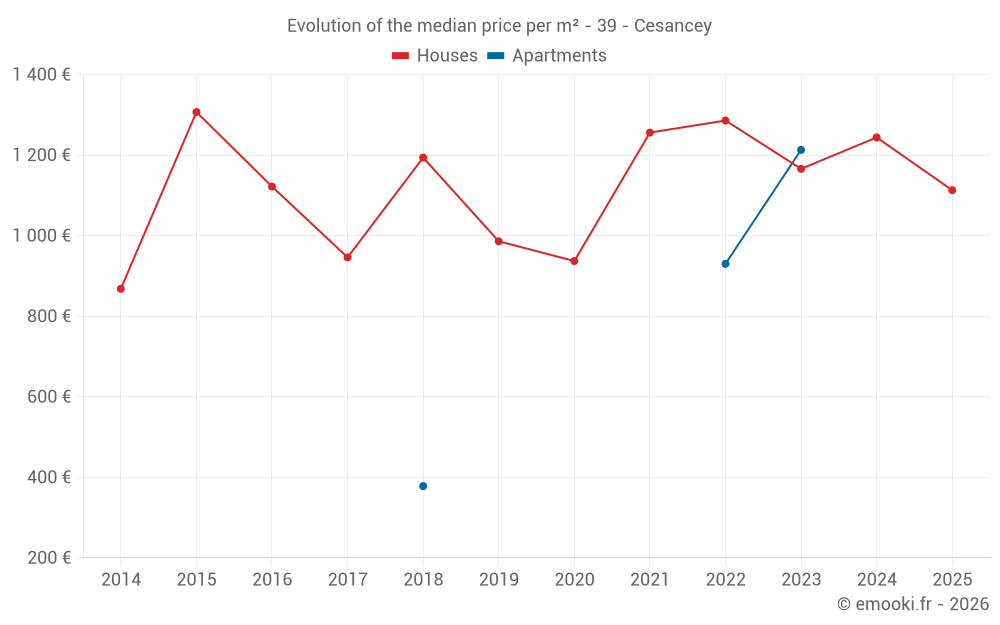
Median price of real estate
in the municipality of Cesancey

HousesHouses
1 202  /m²
1-23-45-67-89-10
Reliability 6/10
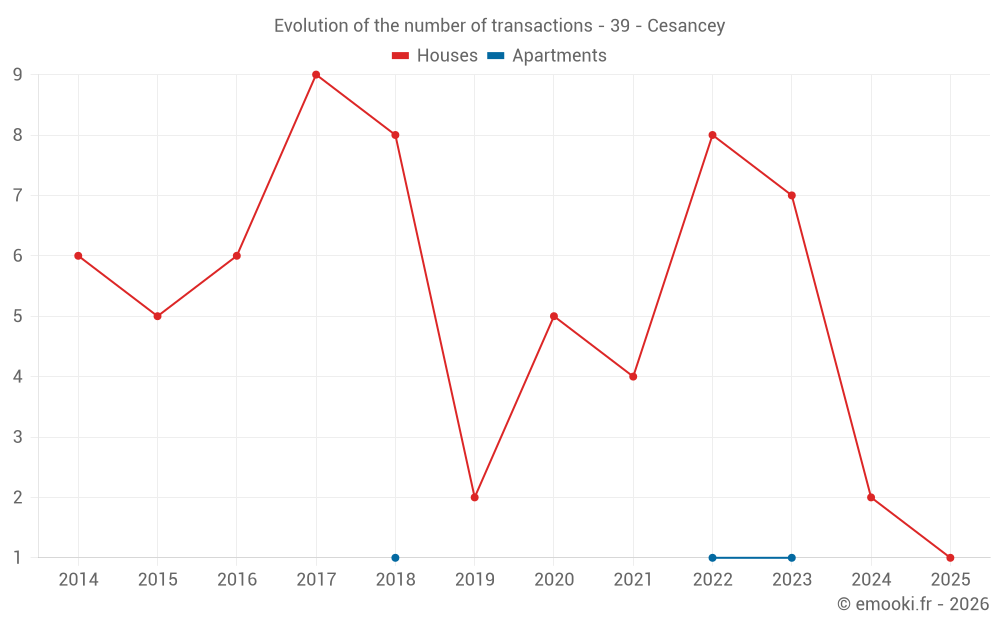
Median price on the 12 transactions of the last 36 months.
from 1 114 to
1 573  /m²
60% of transactions from the 2nd to the 8th deciles.
ApartmentsApartments
930  /m²
1-23-45-67-89-10
Reliability 1/10
Median price on the 3 transactions of the last 120 months.
DwellingsDwellings
1 213  /m²
1-23-45-67-89-10
Reliability 6/10
Median price on the 13 transactions of the last 36 months.
from 1 114 to
1 554  /m²
60% of transactions from the 2nd to the 8th deciles.

Yearly evolution

Evolution of the median price per m²

Evolution of the median price per m² - 39 - Cesancey

Evolution of the number of transactions

Warning, last year incomplete. Projections made based on the proportions between semesters of the previous year at the departmental/national level and by type of property.

Evolution of the number of transactions - 39 - Cesancey

Yearly data

Descending order
Year
Houses
house
transactions
Houses
house
Price per m²
Apartments
apt.
transactions
Apartments
apt.
Price per m²
2025
1
1 113 
0
--- 
2024
2
1 244 
0
--- 
2023
7
1 166 
1
1 213 
2022
8
1 286 
1
930 
2021
4
1 256 
0
--- 
2020
5
937 
0
--- 
2019
2
986 
0
--- 
2018
8
1 194 
1
378 
2017
9
946 
0
--- 
2016
6
1 122 
0
--- 
2015
5
1 307 
0
--- 
2014
6
868 
0
--- 

Analysis

Structure of prices per m²

Values of price percentiles per m² over the periods used for the estimated price of each type of property.

Structure of transaction amounts

Values of transaction amounts percentiles over the periods used for the estimated price of each type of property.

Transaction amounts and prices per m² by percentile

Ascending order
Percentile
Houses
house
Price per m²
Houses
house
Transaction amount
Apartments
apt.
Price per m²
Apartments
apt.
Transaction amount
10th percentile
876 
51 000 
488 
73 600 
20th percentile
1 114 
79 400 
599 
82 200 
30th percentile
1 121 
85 000 
709 
90 800 
40th percentile
1 146 
102 K
820 
99 400 
50th percentile
1 202 
142 K
930 
108 K
60th percentile
1 318 
158 K
987 
118 K
70th percentile
1 461 
166 K
1 043 
129 K
80th percentile
1 573 
182 K
1 100 
139 K
90th percentile
2 059 
213 K
1 156 
150 K

National and departmental comparison

Evolution of the median price per m² of houses

Evolution of the median price per m² of apartments

Quarterly evolution

Evolution of the median price per m²

Evolution of the number of transactions

Quarterly data

Descending order
Quarter
Houses
house
transactions
Houses
house
Price per m²
Apartments
apt.
transactions
Apartments
apt.
Price per m²
2025 Q2
1
1 113 
0
--- 
2024 Q4
1
1 372 
0
--- 
2024 Q1
1
1 116 
0
--- 
2023 Q4
1
1 591 
0
--- 
2023 Q3
2
1 318 
0
--- 
2023 Q2
1
1 133 
0
--- 
2023 Q1
3
1 166 
1
1 213 
2022 Q4
2
1 778 
0
--- 
2022 Q2
3
806 
1
930 
2022 Q1
3
1 333 
0
--- 
2021 Q4
1
519 
0
--- 
2021 Q3
1
1 952 
0
--- 
2021 Q1
2
1 497 
0
--- 
2020 Q4
2
853 
0
--- 
2020 Q3
2
832 
0
--- 
2020 Q2
1
1 346 
0
--- 
2019 Q4
1
583 
0
--- 
2019 Q3
1
1 388 
0
--- 
2018 Q4
2
1 194 
0
--- 
2018 Q3
2
642 
1
378 
2018 Q2
3
1 712 
0
--- 
2018 Q1
1
1 544 
0
--- 
2017 Q4
2
894 
0
--- 
2017 Q2
4
866 
0
--- 
2017 Q1
3
1 077 
0
--- 
2016 Q3
1
948 
0
--- 
2016 Q2
3
833 
0
--- 
2016 Q1
2
1 349 
0
--- 
2015 Q4
1
625 
0
--- 
2015 Q3
1
1 400 
0
--- 
2015 Q2
1
1 307 
0
--- 
2015 Q1
2
1 291 
0
--- 
2014 Q4
2
756 
0
--- 
2014 Q2
2
868 
0
--- 
2014 Q1
2
1 642 
0
--- 

Overview of the latest real estate transactions

The following list is an anonymized overview of the latest transactions. For more details and to find all transactions, please use the map to view transactions by plot or the transaction search page for a search by criteria.

2025-04-25
3 500 
Sale
Land
3490 m2
-Taillis simples
2025-04-08
128 000 
1 113  /m²(115 m²)
Sale
Houses
House
4 rooms
115 m2
Land
530 m2
-Sols
2025-03-28
5 110 
Sale
Land
24908 m2
-Prés
Land
4690 m2
-Taillis simples
2025-03-28
6 469 
Sale
Land
34343 m2
-Prés
Land
1595 m2
-Taillis simples
2025-03-19
3 000 
Sale
Land
20182 m2
-Terres
2025-03-03
1 200 
Sale
Land
1039 m2
-Terres
Land
821 m2
-Vignes
/Vins d'appellation d'origine contrôlée
2025-01-14
25 000 
Sale
Land
3958 m2
-Terres
Land
3957 m2
-Terres
2024-12-31
1 000 
Sale
Land
1266 m2
-Vignes
/Vins d'appellation d'origine contrôlée
2024-11-26
700 
Sale
Land
2564 m2
-Vignes
2024-11-26
500 
Sale
Land
2304 m2
-Terres
2024-10-23
155 000 
1 372  /m²(113 m²)
Sale
Houses
House
4 rooms
113 m2
Land
241 m2
-Sols
Land
79 m2
-Sols
2024-05-14
4 000 
Sale
Land
3155 m2
-Prés
2024-02-16
48 000 
1 116  /m²(43 m²)
Sale
Houses
House
1 room
43 m2
Land
89 m2
-Sols
2023-10-24
608 
Sale
Land
2978 m2
-Taillis simples
2023-10-12
935 
Sale
Land
5196 m2
-Prés
2023-10-06
286 400 
1 591  /m²(180 m²)
Sale
Houses
House
6 rooms
180 m2
Land
1464 m2
-Sols
Land
1508 m2
-Prés
Land
574 m2
-Sols
Land
3973 m2
-Prés
2023-08-28
3 000 
Sale
Land
69 m2
-Sols
2023-08-02
1 800 
Sale
Land
9672 m2
-Taillis simples
2023-07-28
185 747 
2 111  /m²(88 m²)
Sale
Houses
House
4 rooms
88 m2
Land
908 m2
-Terres
Land
717 m2
-Sols
Land
162 m2
-Terres
Land
91 m2
-Prés
2023-07-25
42 000 
525  /m²(80 m²)
Sale
Houses
House
3 rooms
80 m2
Land
1067 m2
-Sols
Land
1450 m2
-Prés
130 transactions listed in the municipality

Jura (39)

Most expensive cities

City
name
Descending orderHouses
house
Price per m²
4 238 
3 961 
3 877 
3 513 
3 178 
3 007 
2 996 
2 918 
2 846 
City
name
Descending orderApartments
apt.
Price per m²
3 853 
3 456 
2 982 
2 732 
2 583 
2 511 
2 361 
2 286 
2 276 

Least expensive cities

City
name
Ascending orderHouses
house
Price per m²
381 
417 
462 
466 
539 
544 
628 
City
name
Ascending orderApartments
apt.
Price per m²
73 
195 
195 
200 
222 
237 
240