emooki
HomePrice mapTransactions
🇬🇧 English🇫🇷 Français🇩🇪 Deutsch🇪🇸 Español🇮🇹 Italiano

Real estate price map


Real estate price map in the municipality of Perrigny, choose a section to see transactions by parcel.

Jura (39)

Perrigny - Real estate price m²

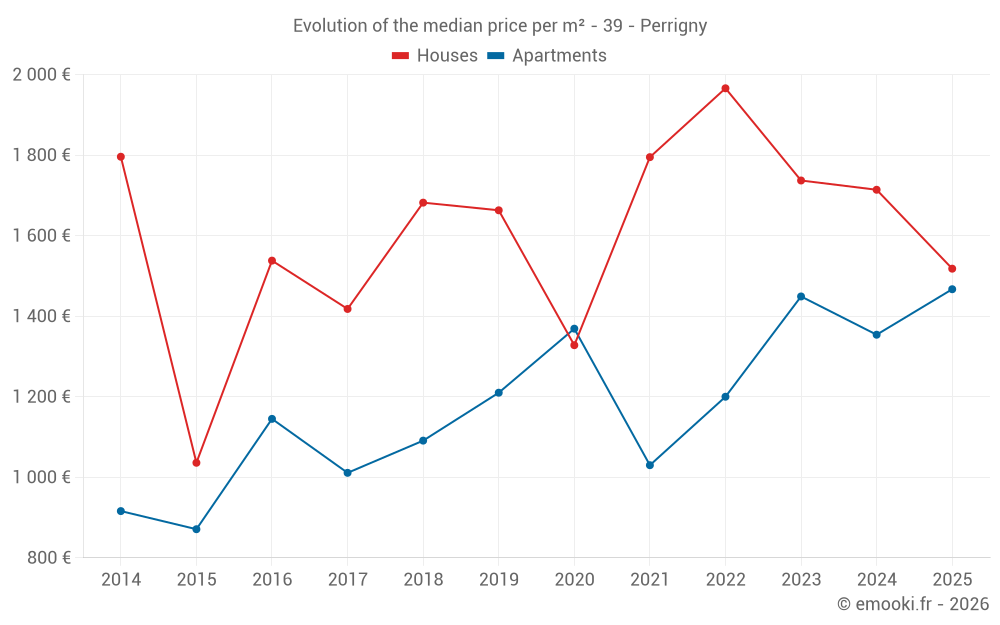
Median price of real estate
in the municipality of Perrigny

HousesHouses
1 664  /m²
1-23-45-67-89-10
Reliability 7/10
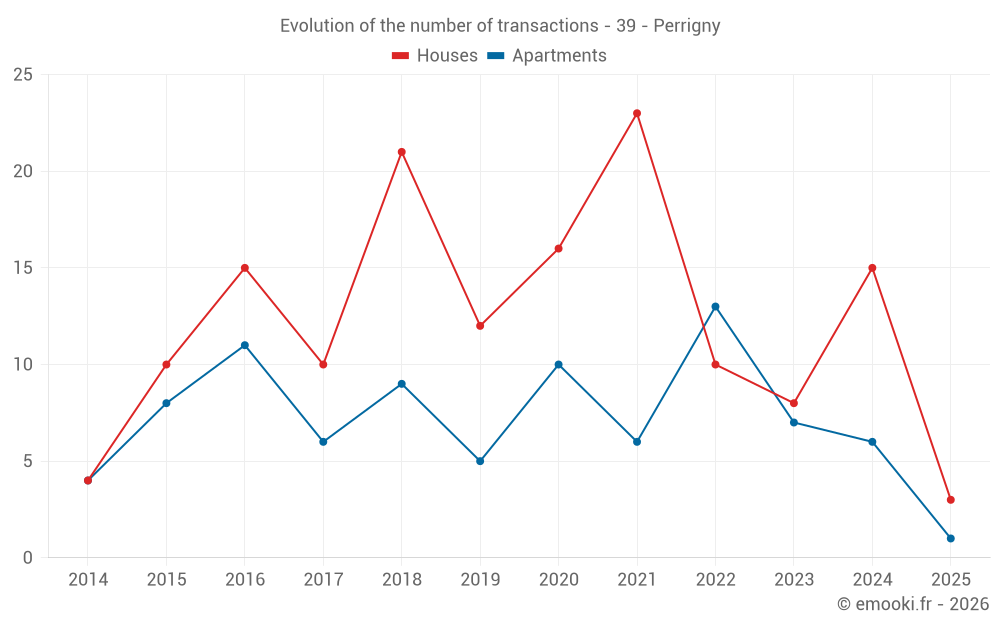
Median price on the 24 transactions of the last 24 months.
from 1 239 to
2 032  /m²
60% of transactions from the 2nd to the 8th deciles.
ApartmentsApartments
1 372  /m²
1-23-45-67-89-10
Reliability 6/10
Median price on the 20 transactions of the last 36 months.
from 1 199 to
1 560  /m²
60% of transactions from the 2nd to the 8th deciles.
DwellingsDwellings
1 558  /m²
1-23-45-67-89-10
Reliability 8/10
Median price on the 17 transactions of the last 12 months.
from 1 400 to
2 051  /m²
60% of transactions from the 2nd to the 8th deciles.

Yearly evolution

Evolution of the median price per m²

Evolution of the median price per m² - 39 - Perrigny

Evolution of the number of transactions

Warning, last year incomplete. Projections made based on the proportions between semesters of the previous year at the departmental/national level and by type of property.

Evolution of the number of transactions - 39 - Perrigny

Yearly data

Descending order
Year
Houses
house
transactions
Houses
house
Price per m²
Apartments
apt.
transactions
Apartments
apt.
Price per m²
2025
3
1 518 
1
1 467 
2024
15
1 714 
6
1 354 
2023
8
1 737 
7
1 449 
2022
10
1 966 
13
1 200 
2021
23
1 795 
6
1 030 
2020
16
1 328 
10
1 369 
2019
12
1 663 
5
1 210 
2018
21
1 682 
9
1 091 
2017
10
1 418 
6
1 011 
2016
15
1 538 
11
1 145 
2015
10
1 036 
8
871 
2014
4
1 796 
4
916 

Analysis

Structure of prices per m²

Values of price percentiles per m² over the periods used for the estimated price of each type of property.

Structure of transaction amounts

Values of transaction amounts percentiles over the periods used for the estimated price of each type of property.

Transaction amounts and prices per m² by percentile

Ascending order
Percentile
Houses
house
Price per m²
Houses
house
Transaction amount
Apartments
apt.
Price per m²
Apartments
apt.
Transaction amount
10th percentile
1 110 
117 K
979 
86 000 
20th percentile
1 239 
120 K
1 199 
89 800 
30th percentile
1 408 
158 K
1 286 
90 320 
40th percentile
1 537 
168 K
1 308 
95 378 
50th percentile
1 664 
179 K
1 372 
99 900 
60th percentile
1 811 
184 K
1 456 
110 K
70th percentile
1 939 
189 K
1 499 
121 K
80th percentile
2 032 
238 K
1 560 
125 K
90th percentile
2 547 
259 K
1 678 
130 K

National and departmental comparison

Evolution of the median price per m² of houses

Evolution of the median price per m² of apartments

Quarterly evolution

Evolution of the median price per m²

Evolution of the number of transactions

Quarterly data

Descending order
Quarter
Houses
house
transactions
Houses
house
Price per m²
Apartments
apt.
transactions
Apartments
apt.
Price per m²
2025 Q2
2
3 066 
1
1 467 
2025 Q1
1
1 029 
0
--- 
2024 Q4
6
1 948 
3
1 311 
2024 Q3
3
1 714 
1
1 396 
2024 Q2
3
1 613 
2
1 382 
2024 Q1
3
1 150 
0
--- 
2023 Q4
4
1 470 
3
1 524 
2023 Q3
2
1 900 
0
--- 
2023 Q2
2
1 738 
2
1 246 
2023 Q1
0
--- 
2
1 510 
2022 Q4
3
2 409 
2
1 166 
2022 Q3
4
1 966 
4
1 428 
2022 Q2
2
1 238 
5
1 200 
2022 Q1
1
1 337 
2
1 128 
2021 Q4
11
1 543 
1
1 107 
2021 Q3
5
1 762 
2
1 439 
2021 Q2
5
1 835 
3
785 
2021 Q1
2
1 824 
0
--- 
2020 Q4
2
970 
1
1 571 
2020 Q3
3
1 013 
3
1 471 
2020 Q2
4
1 556 
3
1 355 
2020 Q1
7
1 333 
3
973 
2019 Q4
4
1 694 
2
1 102 
2019 Q3
1
2 131 
1
1 210 
2019 Q2
3
1 686 
2
1 198 
2019 Q1
4
1 542 
0
--- 
2018 Q4
6
1 582 
2
1 213 
2018 Q3
9
1 682 
3
882 
2018 Q2
3
1 833 
1
1 159 
2018 Q1
3
1 008 
3
893 
2017 Q3
4
1 418 
3
1 029 
2017 Q2
5
1 453 
2
932 
2017 Q1
1
1 248 
1
580 
2016 Q4
2
938 
2
1 034 
2016 Q3
6
1 511 
5
1 159 
2016 Q2
4
1 646 
3
965 
2016 Q1
3
1 850 
1
1 435 
2015 Q4
6
1 285 
3
867 
2015 Q3
2
893 
2
512 
2015 Q2
1
862 
2
1 119 
2015 Q1
1
1 124 
1
875 
2014 Q4
2
1 873 
1
1 107 
2014 Q3
1
1 753 
0
--- 
2014 Q2
1
1 794 
2
818 
2014 Q1
0
--- 
1
726 

Overview of the latest real estate transactions

The following list is an anonymized overview of the latest transactions. For more details and to find all transactions, please use the map to view transactions by plot or the transaction search page for a search by criteria.

2025-06-19
21 419 
Sale
Land
2270 m2
-Prés
Land
1855 m2
-Prés
2025-06-18
68 000 
252  /m²(270 m²)
Sale
Commercial property
200 m2
Commercial property
70 m2
Land
885 m2
-Sols
Land
1039 m2
-Prés
Land
484 m2
-Prés
2025-06-03
5 000 
Sale
Land
474 m2
-Prés
Land
1086 m2
-Prés
2025-05-12
369 000 
4 613  /m²(80 m²)
Sale
Houses
House
4 rooms
80 m2
Land
594 m2
-Sols
2025-05-09
2 060 
Sale
Land
488 m2
-Taillis simples
Land
1063 m2
-Prés
Land
878 m2
-Prés
Land
152 m2
-Taillis simples
2025-04-30
255 000 
1 518  /m²(168 m²)
Sale
Houses
House
5 rooms
168 m2
2 outbuildings
Land
266 m2
-Sols
Land
635 m2
-Sols
2025-04-07
123 220 
1 467  /m²(84 m²)
Sale
Apartments
Apartment
4 rooms
84 m2
2 outbuildings
2025-04-07
635 000 
343  /m²(1849 m²)
Sale
Commercial property
1849 m2
Land
2500 m2
-Sols
Land
1100 m2
-Sols
2025-03-28
823 
Sale
Land
438 m2
-Vignes
/Vins d'appellation d'origine contrôlée
Land
1867 m2
-Prés
Land
438 m2
-Prés
2025-03-20
144 000 
1 029  /m²(140 m²)
Sale
Houses
House
5 rooms
140 m2
Land
345 m2
-Sols
2025-03-19
918 
Sale
Land
510 m2
-Terres
2025-03-18
6 800 
Sale
1 outbuilding
Land
17 m2
-Sols
Land
1132 m2
-Sols
2025-03-12
1 800 
Sale
Land
1665 m2
-Prés
2025-02-07
230 000 
Sale
Commercial property
Land
2000 m2
-Sols
Land
3970 m2
-Terrains d'agrément
/Parc
2025-02-04
8 499 
Sale
Land
514 m2
-Sols
Land
311 m2
-Sols
Land
1225 m2
-Sols
Land
145 m2
-Sols
Land
96 m2
-Terres
Land
1160 m2
-Terres
Land
713 m2
-Terres
Land
582 m2
-Terres
Land
668 m2
-Prés
Land
351 m2
-Prés
Land
435 m2
-Prés
2024-12-26
19 000 
Sale
1 outbuilding
2024-12-23
260 000 
1 781  /m²(146 m²)
Sale
Houses
House
4 rooms
146 m2
Land
931 m2
-Sols
2024-12-19
180 000 
1 818  /m²(99 m²)
Sale
Houses
House
4 rooms
99 m2
Land
1048 m2
-Sols
Land
924 m2
-Prés
Land
32 m2
-Sols
2024-12-12
19 252 
Sale
Land
3180 m2
-Prés
Land
1522 m2
-Prés
2024-12-12
64 322 
2 680  /m²(24 m²)
Sale
Houses
House
1 room
24 m2
Land
585 m2
-Prés
Land
252 m2
-Sols
Land
270 m2
-Terres
Land
446 m2
-Jardins
Land
151 m2
-Terres
Land
444 m2
-Terres
Land
297 m2
-Terres
Land
434 m2
-Prés
Land
60 m2
-Terres
Land
111 m2
-Sols
473 transactions listed in the municipality

Jura (39)

Most expensive cities

City
name
Descending orderHouses
house
Price per m²
4 238 
3 961 
3 877 
3 513 
3 178 
3 007 
2 996 
2 918 
2 846 
City
name
Descending orderApartments
apt.
Price per m²
3 853 
3 456 
2 982 
2 732 
2 583 
2 511 
2 361 
2 286 
2 276 

Least expensive cities

City
name
Ascending orderHouses
house
Price per m²
381 
417 
462 
466 
539 
544 
628 
City
name
Ascending orderApartments
apt.
Price per m²
73 
195 
195 
200 
222 
237 
240