emooki
HomePrice mapTransactions
🇬🇧 English🇫🇷 Français🇩🇪 Deutsch🇪🇸 Español🇮🇹 Italiano

Real estate price map


Real estate price map in the municipality of Beaufort-Orbagna, choose a section to see transactions by parcel.

Jura (39)

Beaufort-Orbagna - Real estate price m²

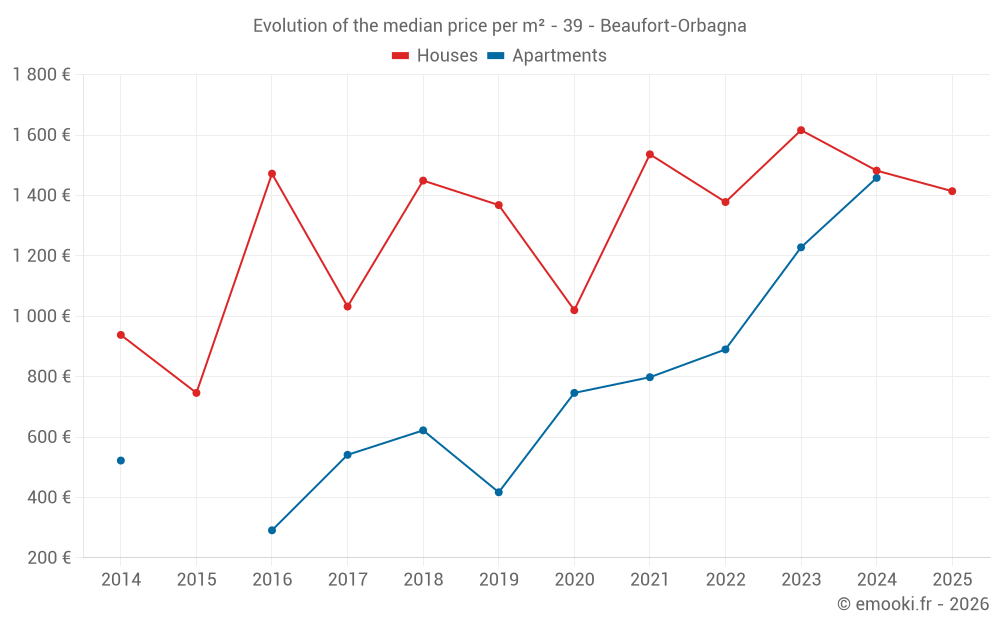
Median price of real estate
in the municipality of Beaufort-Orbagna

HousesHouses
1 429  /m²
1-23-45-67-89-10
Reliability 7/10
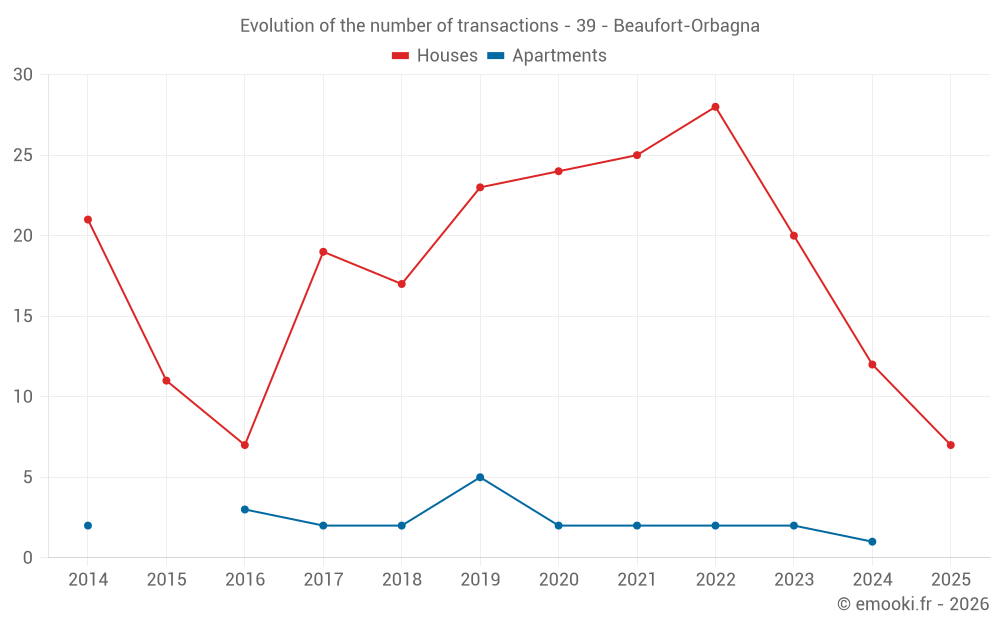
Median price on the 27 transactions of the last 24 months.
from 872 to
1 935  /m²
60% of transactions from the 2nd to the 8th deciles.
ApartmentsApartments
1 028  /m²
1-23-45-67-89-10
Reliability 4/10
Median price on the 8 transactions of the last 60 months.
DwellingsDwellings
1 428  /m²
1-23-45-67-89-10
Reliability 7/10
Median price on the 30 transactions of the last 24 months.
from 879 to
1 890  /m²
60% of transactions from the 2nd to the 8th deciles.
HousesEvolution of the price per m² of houses since...
1 year
-4.6%
2 years
-12%
3 years
+2.6%
4 years
-7.9%
5 years
+39%
6 years
+3.4%
7 years
-2.4%
8 years
+37%
9 years
-3.9%
10 years
+90%
11 years
+51%
The price per m² of houses has decreased by 12% since 2 years, but it has increased by 90% in 10 years.

Yearly evolution

Evolution of the median price per m²

Evolution of the median price per m² - 39 - Beaufort-Orbagna

Evolution of the number of transactions

Warning, last year incomplete. Projections made based on the proportions between semesters of the previous year at the departmental/national level and by type of property.

Evolution of the number of transactions - 39 - Beaufort-Orbagna

Yearly data

Descending order
Year
Houses
house
transactions
Houses
house
Price per m²
Apartments
apt.
transactions
Apartments
apt.
Price per m²
2025
7
1 414 
0
--- 
2024
12
1 482 
1
1 458 
2023
20
1 616 
2
1 228 
2022
28
1 378 
2
890 
2021
25
1 536 
2
798 
2020
24
1 020 
2
746 
2019
23
1 368 
5
417 
2018
17
1 449 
2
622 
2017
19
1 032 
2
541 
2016
7
1 472 
3
291 
2015
11
746 
0
--- 
2014
21
938 
2
522 

Analysis

Structure of prices per m²

Values of price percentiles per m² over the periods used for the estimated price of each type of property.

Structure of transaction amounts

Values of transaction amounts percentiles over the periods used for the estimated price of each type of property.

Transaction amounts and prices per m² by percentile

Ascending order
Percentile
Houses
house
Price per m²
Houses
house
Transaction amount
Apartments
apt.
Price per m²
Apartments
apt.
Transaction amount
10th percentile
743 
77 480 
720 
36 400 
20th percentile
872 
124 K
858 
48 040 
30th percentile
1 076 
150 K
884 
65 440 
40th percentile
1 412 
153 K
924 
71 320 
50th percentile
1 429 
160 K
1 028 
76 000 
60th percentile
1 630 
172 K
1 130 
90 200 
70th percentile
1 741 
176 K
1 162 
129 K
80th percentile
1 935 
197 K
1 268 
138 K
90th percentile
2 204 
250 K
1 372 
151 K

National and departmental comparison

Evolution of the median price per m² of houses

Evolution of the median price per m² of apartments

Quarterly evolution

Evolution of the median price per m²

Evolution of the number of transactions

Quarterly data

Descending order
Quarter
Houses
house
transactions
Houses
house
Price per m²
Apartments
apt.
transactions
Apartments
apt.
Price per m²
2025 Q2
5
1 426 
0
--- 
2025 Q1
2
682 
0
--- 
2024 Q4
3
833 
0
--- 
2024 Q3
3
2 317 
0
--- 
2024 Q2
3
1 411 
0
--- 
2024 Q1
3
1 733 
1
1 458 
2023 Q4
3
1 519 
1
1 121 
2023 Q3
5
1 950 
1
1 335 
2023 Q2
8
1 576 
0
--- 
2023 Q1
4
1 625 
0
--- 
2022 Q4
4
1 228 
0
--- 
2022 Q3
12
1 597 
2
890 
2022 Q2
6
810 
0
--- 
2022 Q1
6
1 952 
0
--- 
2021 Q4
7
1 890 
1
1 167 
2021 Q3
8
1 304 
0
--- 
2021 Q2
5
1 905 
1
429 
2021 Q1
5
1 378 
0
--- 
2020 Q4
9
954 
1
878 
2020 Q3
7
890 
0
--- 
2020 Q2
2
1 586 
1
615 
2020 Q1
6
1 213 
0
--- 
2019 Q4
9
765 
1
417 
2019 Q3
8
1 437 
2
372 
2019 Q2
2
502 
1
150 
2019 Q1
4
1 318 
1
667 
2018 Q4
7
1 449 
2
622 
2018 Q3
2
1 318 
0
--- 
2018 Q2
4
1 136 
0
--- 
2018 Q1
4
1 504 
0
--- 
2017 Q4
5
1 453 
1
367 
2017 Q3
6
870 
0
--- 
2017 Q2
5
1 032 
0
--- 
2017 Q1
3
1 576 
1
715 
2016 Q4
3
1 757 
0
--- 
2016 Q3
1
957 
2
508 
2016 Q2
2
1 014 
1
238 
2016 Q1
1
1 472 
0
--- 
2015 Q4
4
679 
0
--- 
2015 Q3
3
746 
0
--- 
2015 Q2
1
1 615 
0
--- 
2015 Q1
3
1 260 
0
--- 
2014 Q4
8
1 109 
0
--- 
2014 Q3
4
1 060 
1
597 
2014 Q2
7
729 
1
447 
2014 Q1
2
1 178 
0
--- 

Overview of the latest real estate transactions

The following list is an anonymized overview of the latest transactions. For more details and to find all transactions, please use the map to view transactions by plot or the transaction search page for a search by criteria.

2025-06-30
5 000 
Sale
Land
540 m2
-Taillis simples
Land
6740 m2
-Taillis simples
2025-05-27
180 000 
1 875  /m²(96 m²)
Sale
Houses
House
4 rooms
96 m2
Land
1180 m2
-Sols
Land
1582 m2
-Prés
2025-05-10
28 000 
609  /m²(46 m²)
Sale
Houses
House
1 room
46 m2
Land
759 m2
-Sols
2025-04-30
170 000 
1 771  /m²(96 m²)
Sale
Houses
House
5 rooms
96 m2
Land
895 m2
-Sols
2025-04-28
475 000 
1 414  /m²(336 m²)
Sale
Houses
House
5 rooms
168 m2
Houses
House
5 rooms
168 m2
4 outbuildings
Land
17622 m2
-Prés
Land
1570 m2
-Prés
Land
2078 m2
-Sols
Land
280 m2
-Vergers
2025-04-23
174 000 
1 426  /m²(122 m²)
Sale
Houses
House
4 rooms
122 m2
1 outbuilding
Land
404 m2
-Sols
2025-03-20
120 000 
870  /m²(138 m²)
Sale
Houses
House
6 rooms
138 m2
Land
183 m2
-Sols
1 outbuilding
Land
847 m2
-Prés
Land
118 m2
-Sols
Land
118 m2
-Sols
Land
180 m2
-Prés
Land
127 m2
-Prés
2025-03-14
1 970 
Sale
Land
3170 m2
-Terres
Land
1960 m2
-Prés
2025-03-06
78 000 
494  /m²(158 m²)
Sale
Houses
House
4 rooms
79 m2
Houses
House
4 rooms
79 m2
Land
3640 m2
-Prés
Land
1000 m2
-Sols
Land
1820 m2
-Prés
2025-02-28
670 000 
277  /m²(2415 m²)
Sale
Commercial property
1825 m2
Land
3231 m2
-Sols
Commercial property
56 m2
Commercial property
92 m2
Commercial property
409 m2
Commercial property
33 m2
Land
811 m2
-Sols
Land
590 m2
-Terres
Land
2058 m2
-Terres
Land
549 m2
-Terres
2025-01-31
5 000 
Sale
Land
26 m2
-Sols
Land
211 m2
-Jardins
2025-01-21
1 500 
Sale
Land
1096 m2
-Prés
2024-12-20
169 200 
881  /m²(192 m²)
Sale
Houses
House
4 rooms
110 m2
Land
267 m2
-Sols
Houses
House
3 rooms
82 m2
1 outbuilding
Land
340 m2
-Sols
Land
257 m2
-Prés
Land
1023 m2
-Prés
Land
70 m2
-Sols
2024-12-16
765 
Sale
Land
3170 m2
-Prés
Land
470 m2
-Prés
2024-12-13
150 800 
486  /m²(310 m²)
Sale
Houses
House
5 rooms
155 m2
Houses
House
5 rooms
155 m2
Land
2878 m2
-Prés
Land
707 m2
-Sols
Land
1339 m2
-Vignes
/Vins d'appellation d'origine contrôlée
Land
524 m2
-Prés
2024-12-12
32 
Sale
Land
480 m2
-Prés
2024-12-12
14 282 
Sale
Land
33126 m2
-Terres
Land
11042 m2
-Terres
Land
480 m2
-Prés
Land
1890 m2
-Prés
Land
3180 m2
-Prés
Land
13709 m2
-Prés
Land
7983 m2
-Prés
2024-12-12
5 
Sale
Land
480 m2
-Prés
2024-12-04
122 000 
Sale
Land
8680 m2
-Vignes
/Vins d'appellation d'origine contrôlée
Land
1952 m2
-Vignes
/Vins d'appellation d'origine contrôlée
Land
5118 m2
-Vignes
/Vins d'appellation d'origine contrôlée
Land
12770 m2
-Vignes
/Vins d'appellation d'origine contrôlée
Land
2212 m2
-Vignes
/Vins d'appellation d'origine contrôlée
Land
2212 m2
-Prés
2024-11-26
65 000 
833  /m²(78 m²)
Sale
Houses
House
2 rooms
78 m2
Land
500 m2
-Sols
Land
3090 m2
-Prés
467 transactions listed in the municipality

Jura (39)

Most expensive cities

City
name
Descending orderHouses
house
Price per m²
4 238 
3 961 
3 877 
3 513 
3 178 
3 007 
2 996 
2 918 
2 846 
City
name
Descending orderApartments
apt.
Price per m²
3 853 
3 456 
2 982 
2 732 
2 583 
2 511 
2 361 
2 286 
2 276 

Least expensive cities

City
name
Ascending orderHouses
house
Price per m²
381 
417 
462 
466 
539 
544 
628 
City
name
Ascending orderApartments
apt.
Price per m²
73 
195 
195 
200 
222 
237 
240