emooki
HomePrice mapTransactions
🇬🇧 English🇫🇷 Français🇩🇪 Deutsch🇪🇸 Español🇮🇹 Italiano

Real estate price map


Real estate price map in the municipality of Fort-du-Plasne, choose a section to see transactions by parcel.

Jura (39)

Fort-du-Plasne - Real estate price m²

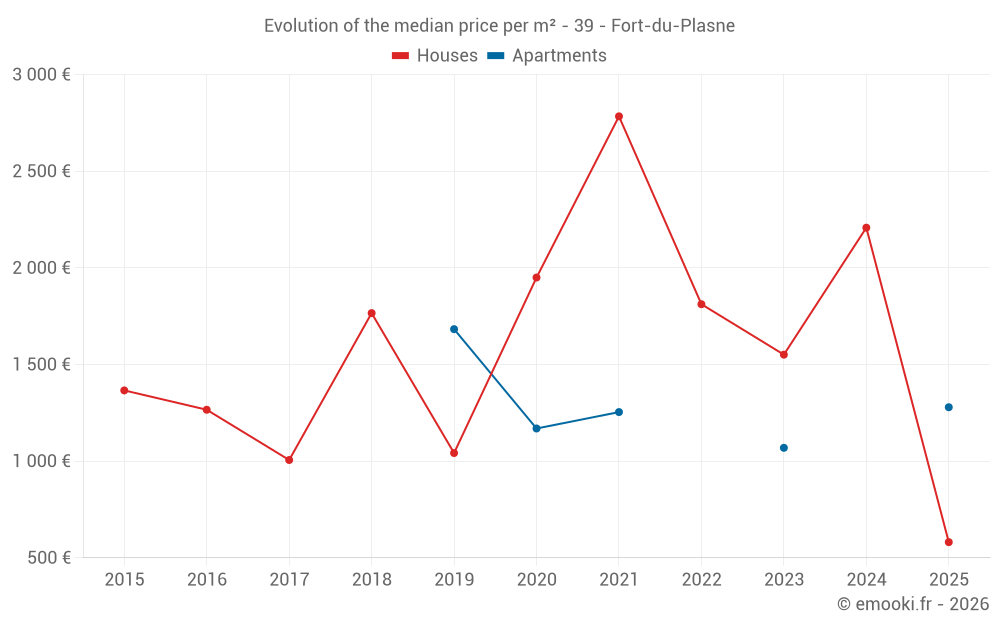
Median price of real estate
in the municipality of Fort-du-Plasne

HousesHouses
1 770  /m²
1-23-45-67-89-10
Reliability 6/10
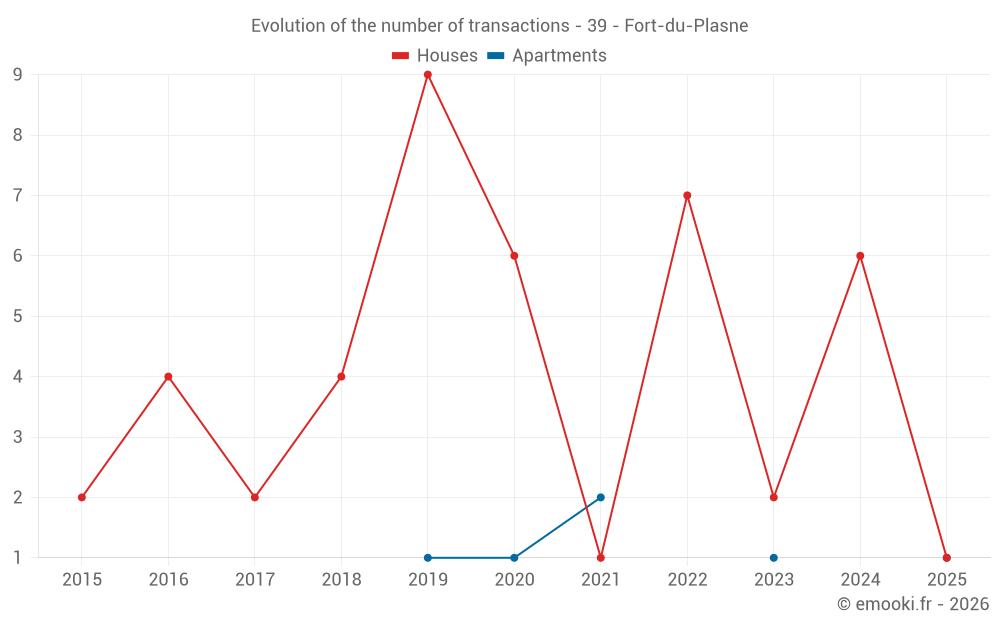
Median price on the 13 transactions of the last 36 months.
from 1 060 to
2 758  /m²
60% of transactions from the 2nd to the 8th deciles.
ApartmentsApartments
1 224  /m²
1-23-45-67-89-10
Reliability 2/10
Median price on the 6 transactions of the last 96 months.
DwellingsDwellings
1 697  /m²
1-23-45-67-89-10
Reliability 6/10
Median price on the 15 transactions of the last 36 months.
from 1 039 to
2 737  /m²
60% of transactions from the 2nd to the 8th deciles.

Yearly evolution

Evolution of the median price per m²

Evolution of the median price per m² - 39 - Fort-du-Plasne

Evolution of the number of transactions

Warning, last year incomplete. Projections made based on the proportions between semesters of the previous year at the departmental/national level and by type of property.

Evolution of the number of transactions - 39 - Fort-du-Plasne

Yearly data

Descending order
Year
Houses
house
transactions
Houses
house
Price per m²
Apartments
apt.
transactions
Apartments
apt.
Price per m²
2025
1
581 
1
1 279 
2024
6
2 208 
0
--- 
2023
2
1 551 
1
1 069 
2022
7
1 812 
0
--- 
2021
1
2 784 
2
1 254 
2020
6
1 950 
1
1 169 
2019
9
1 042 
1
1 683 
2018
4
1 766 
0
--- 
2017
2
1 006 
0
--- 
2016
4
1 266 
0
--- 
2015
2
1 366 
0
--- 
2014
0
--- 
0
--- 

Analysis

Structure of prices per m²

Values of price percentiles per m² over the periods used for the estimated price of each type of property.

Structure of transaction amounts

Values of transaction amounts percentiles over the periods used for the estimated price of each type of property.

Transaction amounts and prices per m² by percentile

Ascending order
Percentile
Houses
house
Price per m²
Houses
house
Transaction amount
Apartments
apt.
Price per m²
Apartments
apt.
Transaction amount
10th percentile
648 
66 000 
1 009 
175 K
20th percentile
1 060 
113 K
1 069 
179 K
30th percentile
1 286 
119 K
1 119 
185 K
40th percentile
1 616 
128 K
1 169 
192 K
50th percentile
1 770 
177 K
1 224 
203 K
60th percentile
2 570 
184 K
1 279 
214 K
70th percentile
2 723 
212 K
1 420 
218 K
80th percentile
2 758 
281 K
1 560 
222 K
90th percentile
3 136 
328 K
1 622 
225 K

National and departmental comparison

Evolution of the median price per m² of houses

Evolution of the median price per m² of apartments

Quarterly evolution

Evolution of the median price per m²

Evolution of the number of transactions

Quarterly data

Descending order
Quarter
Houses
house
transactions
Houses
house
Price per m²
Apartments
apt.
transactions
Apartments
apt.
Price per m²
2025 Q2
0
--- 
1
1 279 
2025 Q1
1
581 
0
--- 
2024 Q4
1
1 697 
0
--- 
2024 Q3
2
2 350 
0
--- 
2024 Q1
3
2 720 
0
--- 
2023 Q4
0
--- 
1
1 069 
2023 Q2
1
2 727 
0
--- 
2023 Q1
1
375 
0
--- 
2022 Q4
3
2 533 
0
--- 
2022 Q3
1
917 
0
--- 
2022 Q1
3
1 812 
0
--- 
2021 Q3
1
2 784 
0
--- 
2021 Q2
0
--- 
2
1 254 
2020 Q4
2
1 245 
0
--- 
2020 Q3
2
2 062 
1
1 169 
2020 Q2
2
2 230 
0
--- 
2019 Q4
2
2 700 
0
--- 
2019 Q3
2
1 096 
0
--- 
2019 Q2
3
1 042 
1
1 683 
2019 Q1
2
661 
0
--- 
2018 Q4
3
2 200 
0
--- 
2018 Q1
1
763 
0
--- 
2017 Q3
1
1 512 
0
--- 
2017 Q1
1
500 
0
--- 
2016 Q4
2
1 156 
0
--- 
2016 Q3
1
533 
0
--- 
2016 Q2
1
2 000 
0
--- 
2015 Q3
1
676 
0
--- 
2015 Q2
1
2 056 
0
--- 

Overview of the latest real estate transactions

The following list is an anonymized overview of the latest transactions. For more details and to find all transactions, please use the map to view transactions by plot or the transaction search page for a search by criteria.

2025-06-25
179 000 
1 279  /m²(140 m²)
Sale
Apartments
Apartment
3 rooms
80 m2
Apartments
Apartment
2 rooms
60 m2
3 outbuildings
Land
230 m2
-Sols
2025-02-27
116 275 
581  /m²(200 m²)
Sale
Houses
House
6 rooms
200 m2
Land
315 m2
-Sols
2024-11-18
185 000 
1 697  /m²(109 m²)
Sale
Houses
House
5 rooms
109 m2
Land
1218 m2
-Sols
Land
196 m2
-Sols
2024-09-27
110 000 
1 294  /m²(85 m²)
Sale
Houses
House
4 rooms
85 m2
Land
540 m2
-Sols
Land
2560 m2
-Terres
2024-08-23
1 805 
86  /m²(21 m²)
Sale
Commercial property
12 m2
Commercial property
9 m2
Land
1805 m2
-Pâtures
2024-07-20
184 000 
3 407  /m²(54 m²)
Sale
Houses
House
1 room
54 m2
Land
669 m2
-Sols
2024-07-09
50 000 
Sale
Land
887 m2
-Sols
2024-07-01
1 154 
Sale
Land
8549 m2
-Pâtures
2024-06-27
7 785 
Sale
Land
8323 m2
-Prés
/Pré marais
2024-03-13
335 450 
3 225  /m²(104 m²)
Sale
Houses
House
5 rooms
104 m2
Land
500 m2
-Sols
Land
877 m2
-Prés
2024-01-31
130 000 
1 275  /m²(102 m²)
Sale
Houses
House
4 rooms
102 m2
Land
310 m2
-Sols
Land
2284 m2
-Terres
Land
197 m2
-Terres
2024-01-13
407 951 
2 720  /m²(150 m²)
Sale
Houses
House
8 rooms
150 m2
Land
760 m2
-Sols
Land
1599 m2
-Prés
2023-12-29
1 000 
Sale
Land
280 m2
-Prés
/Pré marais
Land
79 m2
-Pâtures
Land
461 m2
-Pâtures
Land
4010 m2
-Pâtures
Land
97 m2
-Prés
Land
2183 m2
-Prés
Land
12 m2
-Taillis simples
Land
958 m2
-Taillis simples
Land
254 m2
-Prés
Land
219 m2
-Prés
2023-12-29
140 284 
276  /m²(509 m²)
Sale
Land
1640 m2
-Landes
Commercial property
509 m2
Land
37 m2
-Pâtures
Land
2430 m2
-Pâtures
Land
4407 m2
-Pâtures
2023-12-29
248 716 
808  /m²(308 m²)
Sale
Commercial property
308 m2
2023-12-01
45 000 
Sale
Land
816 m2
-Terres
2023-11-16
1 446 
Sale
Land
5008 m2
-Landes
Land
5703 m2
-Prés
/Pré marais
2023-10-30
171 000 
1 069  /m²(160 m²)
Sale
Apartments
Apartment
3 rooms
95 m2
Apartments
Apartment
2 rooms
65 m2
3 outbuildings
Land
1135 m2
-Terres
Land
440 m2
-Sols
Land
1134 m2
-Terres
Land
3268 m2
-Terres
2023-08-31
230 000 
Sale
Land
2771 m2
-Sols
Land
11747 m2
-Pâtures
2023-05-17
120 000 
2 727  /m²(44 m²)
Sale
Houses
House
3 rooms
44 m2
2 outbuildings
Land
439 m2
-Sols
107 transactions listed in the municipality

Jura (39)

Most expensive cities

City
name
Descending orderHouses
house
Price per m²
4 238 
3 961 
3 877 
3 513 
3 178 
3 007 
2 996 
2 918 
2 846 
City
name
Descending orderApartments
apt.
Price per m²
3 853 
3 456 
2 982 
2 732 
2 583 
2 511 
2 361 
2 286 
2 276 

Least expensive cities

City
name
Ascending orderHouses
house
Price per m²
381 
417 
462 
466 
539 
544 
628 
City
name
Ascending orderApartments
apt.
Price per m²
73 
195 
195 
200 
222 
237 
240