emooki
HomePrice mapTransactions
🇬🇧 English🇫🇷 Français🇩🇪 Deutsch🇪🇸 Español🇮🇹 Italiano

Real estate price map


Real estate price map in the municipality of Monnières, choose a section to see transactions by parcel.

Jura (39)
Monnières

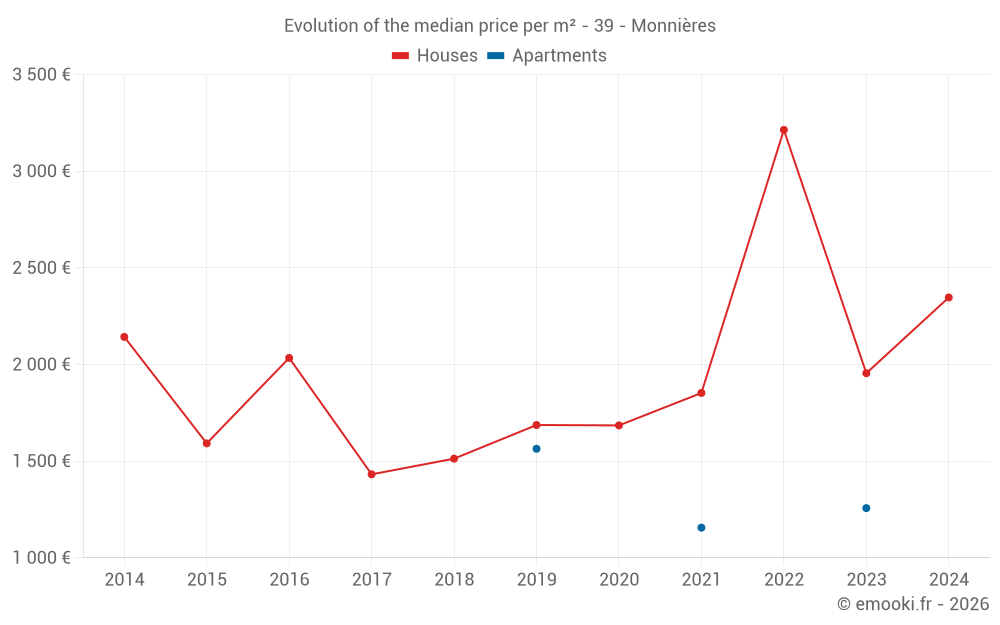
Median price of real estate
in the municipality of Monnières

HousesHouses
2 200  /m²
1-23-45-67-89-10
Reliability 5/10
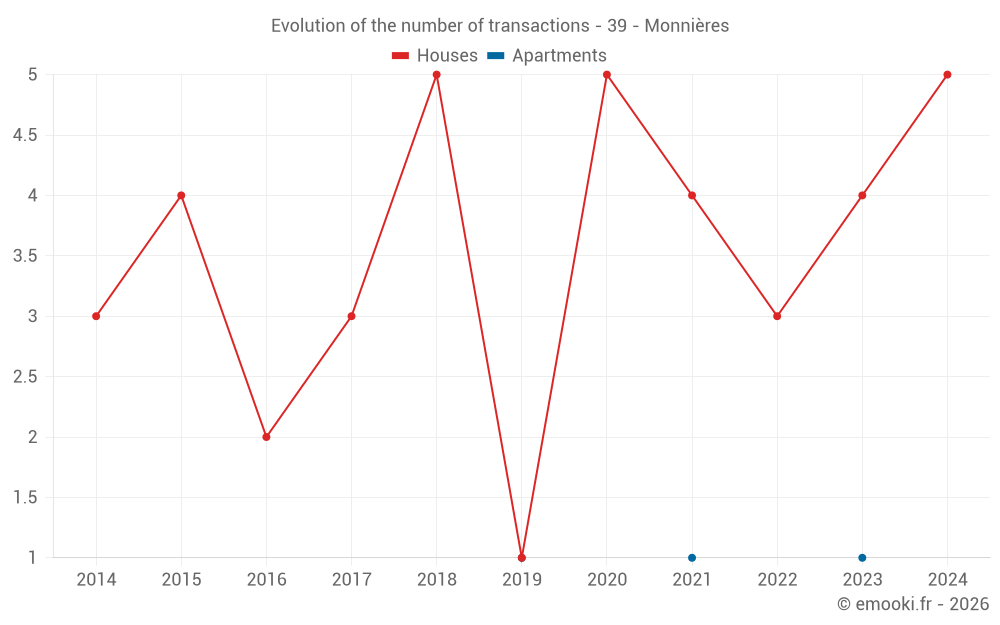
Median price on the 15 transactions of the last 48 months.
from 1 501 to
2 975  /m²
60% of transactions from the 2nd to the 8th deciles.
ApartmentsApartments
1 257  /m²
1-23-45-67-89-10
Reliability 1/10
Median price on the 3 transactions of the last 120 months.
DwellingsDwellings
2 096  /m²
1-23-45-67-89-10
Reliability 6/10
Median price on the 12 transactions of the last 36 months.
from 1 392 to
2 865  /m²
60% of transactions from the 2nd to the 8th deciles.

Yearly evolution

Evolution of the median price per m²

Evolution of the number of transactions

Warning, last year incomplete.

Yearly data

Descending order
Year
Houses
house
transactions
Houses
house
Price per m²
Apartments
apt.
transactions
Apartments
apt.
Price per m²
2025
0
--- 
0
--- 
2024
5
2 347 
0
--- 
2023
4
1 955 
1
1 257 
2022
3
3 214 
0
--- 
2021
4
1 853 
1
1 156 
2020
5
1 685 
0
--- 
2019
1
1 687 
1
1 564 
2018
5
1 513 
0
--- 
2017
3
1 432 
0
--- 
2016
2
2 034 
0
--- 
2015
4
1 592 
0
--- 
2014
3
2 143 
0
--- 

Analysis

Structure of prices per m²

Values of price percentiles per m² over the periods used for the estimated price of each type of property.

Structure of transaction amounts

Values of transaction amounts percentiles over the periods used for the estimated price of each type of property.

Transaction amounts and prices per m² by percentile

Ascending order
Percentile
Houses
house
Price per m²
Houses
house
Transaction amount
Apartments
apt.
Price per m²
Apartments
apt.
Transaction amount
10th percentile
1 019 
123 K
1 176 
234 K
20th percentile
1 501 
157 K
1 196 
235 K
30th percentile
1 765 
173 K
1 217 
237 K
40th percentile
1 988 
182 K
1 237 
238 K
50th percentile
2 200 
220 K
1 257 
240 K
60th percentile
2 294 
227 K
1 318 
249 K
70th percentile
2 422 
259 K
1 380 
257 K
80th percentile
2 975 
301 K
1 441 
266 K
90th percentile
3 124 
347 K
1 503 
274 K

National and departmental comparison

Evolution of the median price per m² of houses

Evolution of the median price per m² of apartments

Quarterly evolution

Evolution of the median price per m²

Evolution of the number of transactions

Quarterly data

Descending order
Quarter
Houses
house
transactions
Houses
house
Price per m²
Apartments
apt.
transactions
Apartments
apt.
Price per m²
2024 Q3
2
2 169 
0
--- 
2024 Q2
1
2 989 
0
--- 
2024 Q1
2
2 254 
0
--- 
2023 Q4
2
1 778 
0
--- 
2023 Q1
2
2 076 
1
1 257 
2022 Q4
1
3 277 
0
--- 
2022 Q3
1
795 
0
--- 
2022 Q2
1
3 214 
0
--- 
2021 Q4
0
--- 
1
1 156 
2021 Q3
3
1 984 
0
--- 
2021 Q2
1
1 722 
0
--- 
2020 Q4
1
2 253 
0
--- 
2020 Q3
1
1 685 
0
--- 
2020 Q2
2
1 617 
0
--- 
2020 Q1
1
707 
0
--- 
2019 Q3
0
--- 
1
1 564 
2019 Q1
1
1 687 
0
--- 
2018 Q4
1
1 155 
0
--- 
2018 Q2
2
1 950 
0
--- 
2018 Q1
2
1 594 
0
--- 
2017 Q2
3
1 432 
0
--- 
2016 Q4
1
2 277 
0
--- 
2016 Q3
1
1 792 
0
--- 
2015 Q4
1
1 591 
0
--- 
2015 Q3
2
1 925 
0
--- 
2015 Q2
1
1 181 
0
--- 
2014 Q3
2
1 848 
0
--- 
2014 Q2
1
2 143 
0
--- 

Overview of the latest real estate transactions

The following list is an anonymized overview of the latest transactions. For more details and to find all transactions, please use the map to view transactions by plot or the transaction search page for a search by criteria.

2024-12-06
1 200 
Sale
Land
596 m2
-Vignes
2024-09-25
230 000 
2 347  /m²(98 m²)
Sale
Houses
House
4 rooms
98 m2
3 outbuildings
Land
2303 m2
-Sols
Land
113 m2
-Terres
2024-09-10
5 000 
Sale
Land
2107 m2
-Terres
2024-08-23
183 200 
1 991  /m²(92 m²)
Sale
Houses
House
5 rooms
92 m2
Land
569 m2
-Sols
Land
597 m2
-Terres
2024-08-09
84 000 
249  /m²(338 m²)
2 545  /m²(33 m²)
Sale
Apartments
Apartment
2 rooms
33 m2
Commercial property
305 m2
1 outbuilding
Land
1630 m2
-Sols
Land
1094 m2
-Terres
2024-08-09
92 000 
272  /m²(338 m²)
2 788  /m²(33 m²)
Sale
Apartments
Apartment
2 rooms
33 m2
Commercial property
305 m2
1 outbuilding
Land
1630 m2
-Sols
Land
3150 m2
-Terres
2024-06-14
266 000 
2 989  /m²(89 m²)
Sale
Houses
House
5 rooms
89 m2
1 outbuilding
Land
512 m2
-Sols
Land
3855 m2
-Terres
Land
2907 m2
-Terres
2024-06-04
47 000 
Sale
Land
549 m2
-Terrains à bâtir
Land
272 m2
-Terrains à bâtir
Land
2 m2
-Terrains à bâtir
Land
209 m2
-Terrains à bâtir
2024-01-15
312 000 
2 971  /m²(105 m²)
Sale
Houses
House
5 rooms
105 m2
Land
1109 m2
-Sols
Land
2839 m2
-Terres
2024-01-05
158 400 
1 538  /m²(103 m²)
Sale
Houses
House
4 rooms
103 m2
Land
179 m2
-Sols
Land
177 m2
-Sols
2023-11-24
149 000 
1 355  /m²(110 m²)
Sale
Houses
House
5 rooms
110 m2
Land
527 m2
-Sols
Land
167 m2
-Terres
2023-11-13
220 000 
2 200  /m²(100 m²)
Sale
Houses
House
6 rooms
100 m2
1 outbuilding
Land
835 m2
-Sols
2023-11-09
50 000 
Sale
Land
532 m2
-Terrains à bâtir
Land
272 m2
-Terrains à bâtir
Land
2 m2
-Terrains à bâtir
Land
209 m2
-Terrains à bâtir
2023-10-12
71 250 
Sale
Land
756 m2
-Terrains à bâtir
Land
272 m2
-Terrains à bâtir
Land
2 m2
-Terrains à bâtir
Land
209 m2
-Terrains à bâtir
2023-07-25
120 000 
429  /m²(280 m²)
Sale
Commercial property
280 m2
Land
1370 m2
-Sols
2023-03-27
240 000 
1 257  /m²(191 m²)
Sale
Apartments
Apartment
2 rooms
70 m2
Apartments
Apartment
5 rooms
121 m2
5 outbuildings
Land
889 m2
-Sols
Land
553 m2
-Terres
Land
532 m2
-Terres
Land
549 m2
-Terres
Land
756 m2
-Terres
Land
272 m2
-Terres
Land
2 m2
-Terres
Land
209 m2
-Sols
2023-03-21
171 000 
1 710  /m²(100 m²)
Sale
Houses
House
5 rooms
100 m2
Land
1350 m2
-Sols
2023-02-11
10 700 
Sale
Land
195 m2
-Sols
2023-01-26
371 000 
2 441  /m²(152 m²)
Sale
Houses
House
6 rooms
152 m2
Land
1000 m2
-Sols
Land
534 m2
-Jardins
2023-01-13
13 793 
Sale
Land
1061 m2
-Terres
65 transactions listed in the municipality

Jura (39)

Most expensive cities

City
name
Descending orderHouses
house
Price per m²
4 238 
3 961 
3 877 
3 513 
3 178 
3 007 
2 996 
2 918 
2 846 
City
name
Descending orderApartments
apt.
Price per m²
3 853 
3 456 
2 982 
2 732 
2 583 
2 511 
2 361 
2 286 
2 276 

Least expensive cities

City
name
Ascending orderHouses
house
Price per m²
381 
417 
462 
466 
539 
544 
628 
City
name
Ascending orderApartments
apt.
Price per m²
73 
195 
195 
200 
222 
237 
240