emooki
HomePrice mapTransactions
🇬🇧 English🇫🇷 Français🇩🇪 Deutsch🇪🇸 Español🇮🇹 Italiano

Real estate price map


Real estate price map in the Guadeloupe department.

Department 971
Guadeloupe

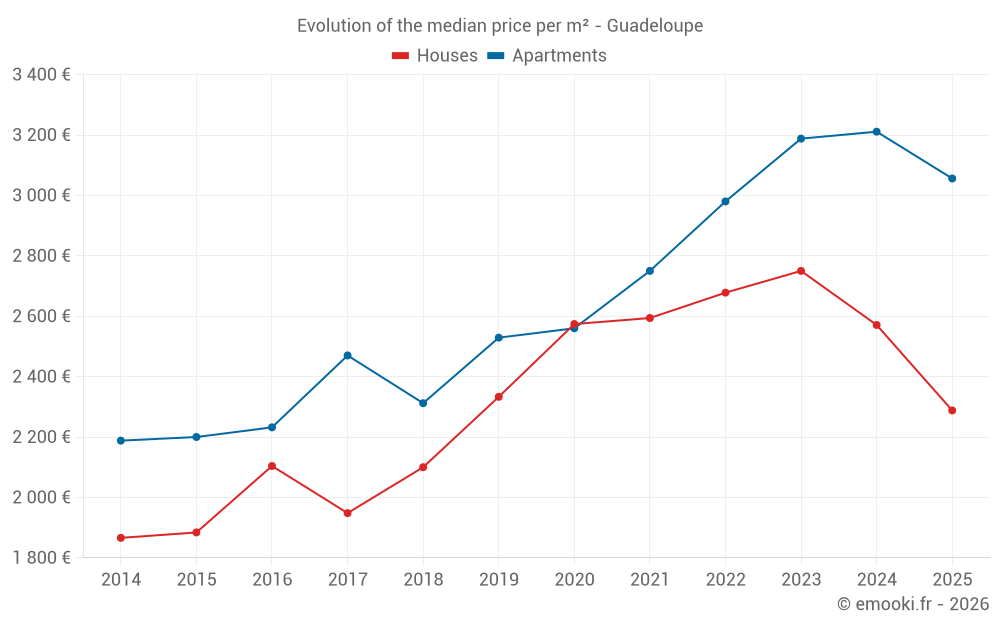
Median price of real estate
in the Guadeloupe department

HousesHouses
2 288 € /m²
1-23-45-67-89-10
Reliability 9/10
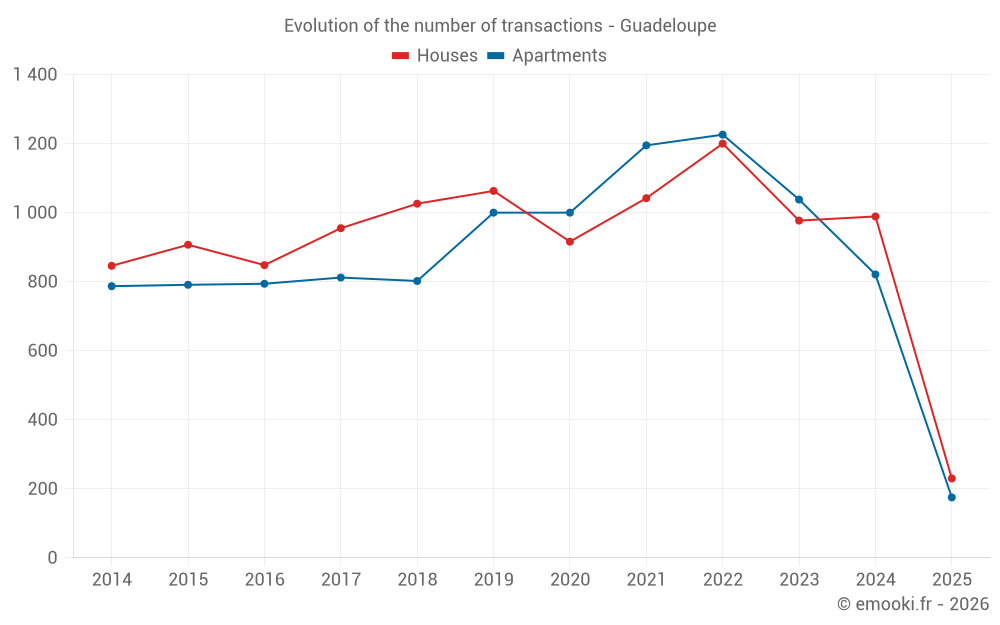
Median price on the 230 transactions of the last 6 months.
from 559 to
4 194 € /m²
60% of transactions from the 2nd to the 8th deciles.
ApartmentsApartments
3 056 € /m²
1-23-45-67-89-10
Reliability 9/10
Median price on the 175 transactions of the last 6 months.
from 1 667 to
4 566 € /m²
60% of transactions from the 2nd to the 8th deciles.
DwellingsDwellings
2 662 € /m²
1-23-45-67-89-10
Reliability 9/10
Median price on the 405 transactions of the last 6 months.
from 1 084 to
4 371 € /m²
60% of transactions from the 2nd to the 8th deciles.
HousesEvolution of the price per m² of houses since...
1 year
-11%
2 years
-17%
3 years
-15%
4 years
-12%
5 years
-11%
6 years
-1.9%
7 years
+9%
8 years
+17%
9 years
+8.7%
10 years
+21%
11 years
+23%
ApartmentsEvolution of the price per m² of apartments since...
1 year
-4.8%
2 years
-4.1%
3 years
+2.6%
4 years
+11%
5 years
+19%
6 years
+21%
7 years
+32%
8 years
+24%
9 years
+37%
10 years
+39%
11 years
+40%

Yearly evolution

Evolution of the median price per m²

Evolution of the number of transactions

Warning, last year incomplete. Projections made based on the proportions between semesters of the previous year at the departmental/national level and by type of property.

Yearly data

Descending order
Year
Houses
house
transactions
Houses
house
Price per m²
Apartments
apt.
transactions
Apartments
apt.
Price per m²
2025
230
2 288 €
175
3 056 €
2024
989
2 571 €
821
3 211 €
2023
977
2 750 €
1 038
3 188 €
2022
1 200
2 678 €
1 226
2 980 €
2021
1 042
2 594 €
1 195
2 750 €
2020
916
2 574 €
1 000
2 560 €
2019
1 063
2 333 €
1 000
2 529 €
2018
1 026
2 100 €
802
2 312 €
2017
955
1 948 €
812
2 470 €
2016
848
2 104 €
794
2 232 €
2015
907
1 884 €
791
2 200 €
2014
846
1 866 €
787
2 188 €

Analysis

Structure of prices per m²

Values of price percentiles per m² over the periods used for the estimated price of each type of property.

Structure of transaction amounts

Values of transaction amounts percentiles over the periods used for the estimated price of each type of property.

Transaction amounts and prices per m² by percentile

Ascending order
Percentile
Houses
house
Price per m²
Houses
house
Transaction amount
Apartments
apt.
Price per m²
Apartments
apt.
Transaction amount
10th percentile
79 €
7 641 €
1 172 €
65 800 €
20th percentile
559 €
46 525 €
1 667 €
85 680 €
30th percentile
1 275 €
92 944 €
2 185 €
111 K€
40th percentile
2 004 €
162 K€
2 750 €
130 K€
50th percentile
2 288 €
200 K€
3 056 €
145 K€
60th percentile
2 712 €
260 K€
3 504 €
159 K€
70th percentile
3 459 €
329 K€
4 030 €
190 K€
80th percentile
4 194 €
395 K€
4 566 €
208 K€
90th percentile
5 501 €
502 K€
5 237 €
246 K€

Quarterly evolution

Evolution of the median price per m²

Evolution of the number of transactions

Quarterly data

Descending order
Quarter
Houses
house
transactions
Houses
house
Price per m²
Apartments
apt.
transactions
Apartments
apt.
Price per m²
2025 Q2
34
2 308 €
12
3 259 €
2025 Q1
196
2 282 €
163
3 056 €
2024 Q4
275
2 692 €
220
3 150 €
2024 Q3
269
2 560 €
229
3 214 €
2024 Q2
253
2 456 €
191
3 261 €
2024 Q1
192
2 542 €
181
3 125 €
2023 Q4
235
2 451 €
220
3 004 €
2023 Q3
294
2 594 €
265
3 103 €
2023 Q2
238
2 948 €
276
3 382 €
2023 Q1
210
2 942 €
277
3 182 €
2022 Q4
354
2 441 €
304
3 154 €
2022 Q3
325
2 919 €
302
3 083 €
2022 Q2
257
2 722 €
329
2 927 €
2022 Q1
264
2 568 €
291
2 815 €
2021 Q4
282
2 646 €
337
2 939 €
2021 Q3
274
2 667 €
338
2 648 €
2021 Q2
239
2 647 €
267
2 733 €
2021 Q1
247
2 427 €
253
2 605 €
2020 Q4
308
2 340 €
321
2 593 €
2020 Q3
221
2 817 €
265
2 464 €
2020 Q2
194
2 670 €
206
2 623 €
2020 Q1
193
2 525 €
208
2 587 €
2019 Q4
277
2 380 €
257
2 469 €
2019 Q3
298
2 382 €
272
2 642 €
2019 Q2
260
2 320 €
260
2 502 €
2019 Q1
228
2 308 €
211
2 442 €
2018 Q4
319
1 989 €
251
2 222 €
2018 Q3
281
2 181 €
222
2 348 €
2018 Q2
218
2 188 €
174
2 453 €
2018 Q1
208
2 082 €
155
2 250 €
2017 Q4
290
1 851 €
173
2 477 €
2017 Q3
194
2 040 €
201
2 525 €
2017 Q2
273
2 012 €
249
2 414 €
2017 Q1
198
2 010 €
189
2 485 €
2016 Q4
246
1 974 €
211
2 286 €
2016 Q3
211
2 197 €
219
2 293 €
2016 Q2
216
2 224 €
196
2 216 €
2016 Q1
175
2 159 €
168
2 163 €
2015 Q4
245
1 806 €
227
2 226 €
2015 Q3
260
2 078 €
238
2 216 €
2015 Q2
224
1 812 €
179
2 182 €
2015 Q1
178
1 959 €
147
2 104 €
2014 Q4
236
1 947 €
231
2 059 €
2014 Q3
219
1 944 €
199
2 444 €
2014 Q2
188
1 990 €
176
2 174 €
2014 Q1
203
1 586 €
181
1 960 €

Guadeloupe (971)

Most expensive cities

City
name
Descending orderHouses
house
Price per m²
6 559 €
4 778 €
3 545 €
3 469 €
3 458 €
3 284 €
3 116 €
2 772 €
2 731 €
2 722 €
City
name
Descending orderApartments
apt.
Price per m²
5 484 €
4 995 €
4 390 €
3 899 €
3 560 €
3 335 €
3 129 €
3 058 €
3 034 €
2 802 €

Least expensive cities

City
name
Ascending orderHouses
house
Price per m²
51 €
389 €
591 €
726 €
867 €
896 €
1 016 €
1 158 €
1 316 €
1 328 €
City
name
Ascending orderApartments
apt.
Price per m²
30 €
58 €
738 €
862 €
1 100 €
1 167 €
1 170 €
1 197 €
1 310 €
1 421 €