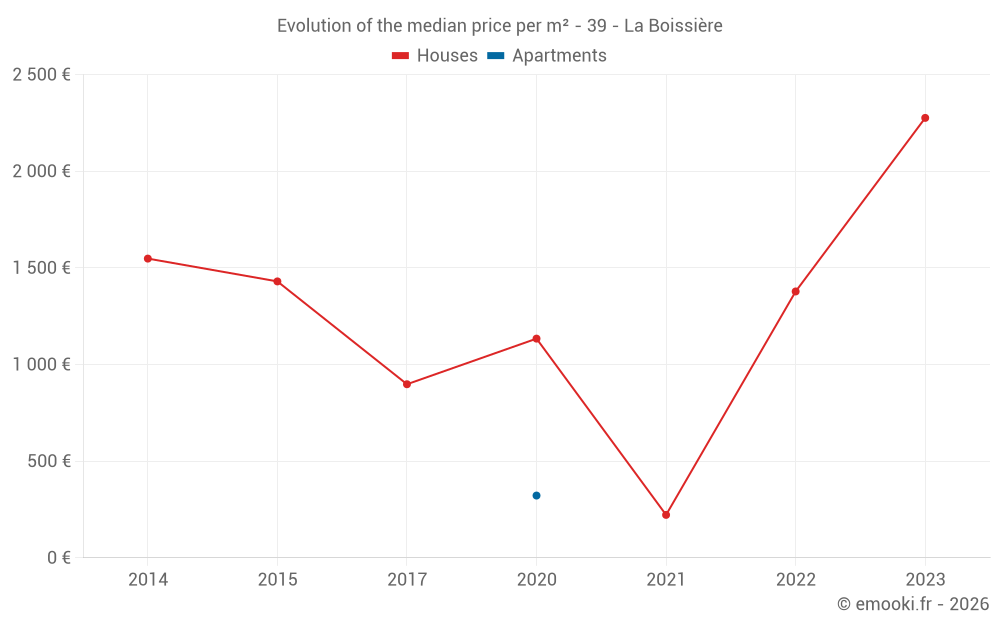
Median price of real estate
in the municipality of La Boissière
Houses
1 378 € /m²
Reliability 5/10
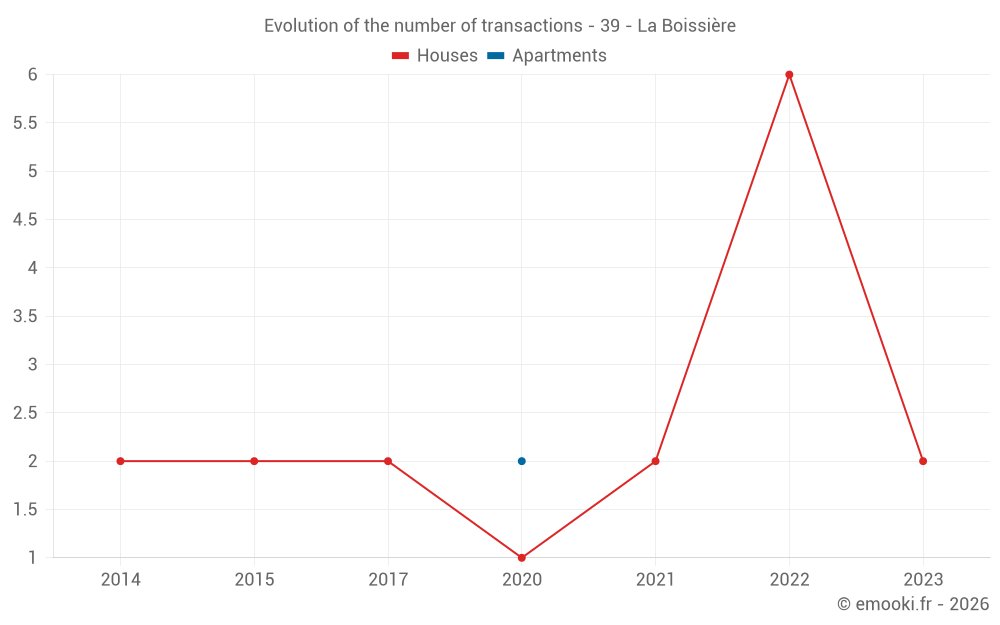
Median price on the 10 transactions of the last 48 months.
Apartments
322 € /m²
Reliability 1/10
Median price on the 2 transactions of the last 120 months.
Dwellings
1 378 € /m²
Reliability 5/10
Median price on the 10 transactions of the last 48 months.