emooki
HomePrice mapTransactions
🇬🇧 English🇫🇷 Français🇩🇪 Deutsch🇪🇸 Español🇮🇹 Italiano

Real estate price map


Real estate price map in the municipality of Val-Sonnette, choose a section to see transactions by parcel.

Jura (39)

Val-Sonnette - Real estate price m²

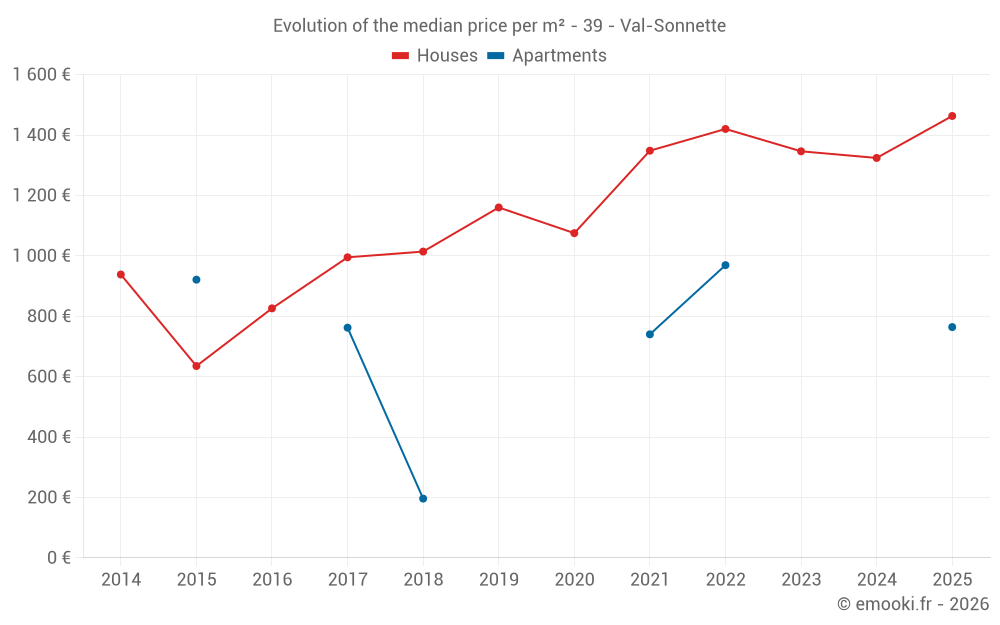
Median price of real estate
in the municipality of Val-Sonnette

HousesHouses
1 463  /m²
1-23-45-67-89-10
Reliability 7/10
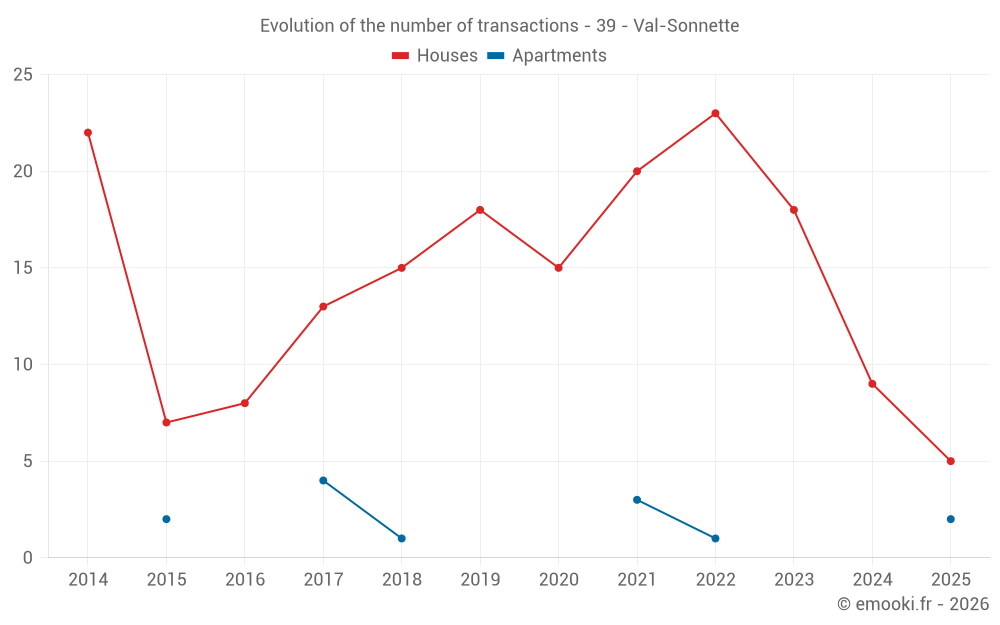
Median price on the 21 transactions of the last 24 months.
from 548 to
1 911  /m²
60% of transactions from the 2nd to the 8th deciles.
ApartmentsApartments
770  /m²
1-23-45-67-89-10
Reliability 3/10
Median price on the 6 transactions of the last 72 months.
DwellingsDwellings
1 324  /m²
1-23-45-67-89-10
Reliability 7/10
Median price on the 23 transactions of the last 24 months.
from 604 to
1 852  /m²
60% of transactions from the 2nd to the 8th deciles.
HousesEvolution of the price per m² of houses since...
1 year
+10%
2 years
+8.7%
3 years
+3%
4 years
+8.5%
5 years
+36%
6 years
+26%
7 years
+44%
8 years
+47%
9 years
+77%
10 years
+130%
11 years
+56%

Yearly evolution

Evolution of the median price per m²

Evolution of the median price per m² - 39 - Val-Sonnette

Evolution of the number of transactions

Warning, last year incomplete. Projections made based on the proportions between semesters of the previous year at the departmental/national level and by type of property.

Evolution of the number of transactions - 39 - Val-Sonnette

Yearly data

Descending order
Year
Houses
house
transactions
Houses
house
Price per m²
Apartments
apt.
transactions
Apartments
apt.
Price per m²
2025
5
1 463 
2
764 
2024
9
1 324 
0
--- 
2023
18
1 346 
0
--- 
2022
23
1 420 
1
969 
2021
20
1 348 
3
740 
2020
15
1 075 
0
--- 
2019
18
1 160 
0
--- 
2018
15
1 014 
1
196 
2017
13
995 
4
762 
2016
8
826 
0
--- 
2015
7
635 
2
921 
2014
22
938 
0
--- 

Analysis

Structure of prices per m²

Values of price percentiles per m² over the periods used for the estimated price of each type of property.

Structure of transaction amounts

Values of transaction amounts percentiles over the periods used for the estimated price of each type of property.

Transaction amounts and prices per m² by percentile

Ascending order
Percentile
Houses
house
Price per m²
Houses
house
Transaction amount
Apartments
apt.
Price per m²
Apartments
apt.
Transaction amount
10th percentile
286 
20 000 
456 
28 500 
20th percentile
548 
55 000 
729 
37 000 
30th percentile
855 
85 500 
734 
53 500 
40th percentile
1 055 
105 K
740 
70 000 
50th percentile
1 463 
117 K
770 
103 K
60th percentile
1 471 
132 K
799 
135 K
70th percentile
1 607 
185 K
884 
145 K
80th percentile
1 911 
211 K
969 
155 K
90th percentile
2 175 
248 K
1 812 
248 K

National and departmental comparison

Evolution of the median price per m² of houses

Evolution of the median price per m² of apartments

Quarterly evolution

Evolution of the median price per m²

Evolution of the number of transactions

Quarterly data

Descending order
Quarter
Houses
house
transactions
Houses
house
Price per m²
Apartments
apt.
transactions
Apartments
apt.
Price per m²
2025 Q2
4
1 483 
1
729 
2025 Q1
1
1 463 
1
799 
2024 Q4
1
2 056 
0
--- 
2024 Q3
4
928 
0
--- 
2024 Q2
3
286 
0
--- 
2024 Q1
1
1 591 
0
--- 
2023 Q4
4
1 159 
0
--- 
2023 Q3
3
2 175 
0
--- 
2023 Q2
4
1 371 
0
--- 
2023 Q1
7
1 256 
0
--- 
2022 Q4
3
1 325 
0
--- 
2022 Q3
5
1 596 
0
--- 
2022 Q2
5
1 457 
1
969 
2022 Q1
10
1 170 
0
--- 
2021 Q4
6
1 324 
2
1 420 
2021 Q3
5
2 036 
1
740 
2021 Q2
6
1 348 
0
--- 
2021 Q1
3
936 
0
--- 
2020 Q4
7
1 075 
0
--- 
2020 Q3
2
1 740 
0
--- 
2020 Q2
3
759 
0
--- 
2020 Q1
3
1 029 
0
--- 
2019 Q4
6
1 560 
0
--- 
2019 Q3
6
1 002 
0
--- 
2019 Q2
3
632 
0
--- 
2019 Q1
3
1 280 
0
--- 
2018 Q4
4
1 519 
0
--- 
2018 Q3
5
867 
0
--- 
2018 Q2
5
1 029 
0
--- 
2018 Q1
1
829 
1
196 
2017 Q4
5
913 
2
972 
2017 Q3
3
1 346 
0
--- 
2017 Q2
3
1 478 
1
748 
2017 Q1
2
803 
1
563 
2016 Q4
2
746 
0
--- 
2016 Q3
3
753 
0
--- 
2016 Q2
2
1 035 
0
--- 
2016 Q1
1
1 000 
0
--- 
2015 Q4
1
560 
0
--- 
2015 Q3
1
556 
1
429 
2015 Q2
2
950 
0
--- 
2015 Q1
3
1 027 
1
1 413 
2014 Q4
2
1 240 
0
--- 
2014 Q3
5
1 250 
0
--- 
2014 Q2
7
838 
0
--- 
2014 Q1
8
784 
0
--- 

Overview of the latest real estate transactions

The following list is an anonymized overview of the latest transactions. For more details and to find all transactions, please use the map to view transactions by plot or the transaction search page for a search by criteria.

2025-06-18
4 000 
Sale
Land
6545 m2
-Taillis simples
2025-06-16
28 000 
Sale
Land
1866 m2
-Sols
2025-04-24
131 500 
981  /m²(134 m²)
Sale
Houses
House
3 rooms
134 m2
1 outbuilding
Land
874 m2
-Sols
Land
2800 m2
-Prés
Land
241 m2
-Sols
2025-04-23
228 000 
2 327  /m²(98 m²)
Sale
Houses
House
5 rooms
98 m2
Land
1087 m2
-Sols
2025-04-19
70 000 
729  /m²(96 m²)
Sale
Apartments
Apartment
5 rooms
96 m2
2 outbuildings
2025-04-17
4 000 
Sale
Land
3314 m2
-Prés
Land
4858 m2
-Prés
Land
9718 m2
-Prés
2025-04-07
105 450 
1 055  /m²(100 m²)
Sale
Houses
House
2 rooms
100 m2
Land
62 m2
-Sols
Land
106 m2
-Jardins
2025-04-02
206 400 
1 911  /m²(108 m²)
Sale
Houses
House
4 rooms
108 m2
Land
1300 m2
-Sols
Land
1252 m2
-Prés
2025-04-01
1 500 
Sale
Land
872 m2
-Prés
Land
1569 m2
-Terres
2025-03-18
135 000 
799  /m²(169 m²)
Sale
Apartments
Apartment
3 rooms
79 m2
Apartments
Apartment
4 rooms
90 m2
1 outbuilding
Land
316 m2
-Sols
Land
79 m2
-Sols
2025-02-21
210 700 
1 463  /m²(144 m²)
Sale
Houses
House
5 rooms
144 m2
1 outbuilding
Land
301 m2
-Sols
2025-02-06
7 000 
Sale
Land
18633 m2
-Taillis sous futaie
/CHENE
Land
4166 m2
-Peupleraies
Land
5798 m2
-Terres
Land
14952 m2
-Taillis simples
Land
23413 m2
-Prés
Land
2221 m2
-Taillis simples
2025-02-03
400 
Sale
Land
411 m2
-Vignes
Land
439 m2
-Pâtures
2025-01-31
40 000 
Sale
Land
1808 m2
-Vergers
2024-12-19
200 
Sale
Land
625 m2
-Terres
2024-12-12
14 282 
Sale
Land
33126 m2
-Terres
Land
11042 m2
-Terres
Land
480 m2
-Prés
Land
1890 m2
-Prés
Land
3180 m2
-Prés
Land
13709 m2
-Prés
Land
7983 m2
-Prés
2024-11-07
185 000 
2 056  /m²(90 m²)
Sale
Houses
House
3 rooms
90 m2
Land
719 m2
-Sols
2024-10-04
94 476 
Sale
3 outbuildings
2024-10-03
12 000 
Sale
Land
4626 m2
-Taillis simples
Land
23553 m2
-Taillis simples
Land
4511 m2
-Taillis simples
2024-09-25
65 000 
533  /m²(122 m²)
Sale
Houses
House
3 rooms
122 m2
Land
65 m2
-Sols
Land
25 m2
-Sols
Land
32 m2
-Sols
Land
26 m2
-Sols
Land
20 m2
-Sols
476 transactions listed in the municipality

Jura (39)

Most expensive cities

City
name
Descending orderHouses
house
Price per m²
4 238 
3 961 
3 877 
3 513 
3 178 
3 007 
2 996 
2 918 
2 846 
City
name
Descending orderApartments
apt.
Price per m²
3 853 
3 456 
2 982 
2 732 
2 583 
2 511 
2 361 
2 286 
2 276 

Least expensive cities

City
name
Ascending orderHouses
house
Price per m²
381 
417 
462 
466 
539 
544 
628 
City
name
Ascending orderApartments
apt.
Price per m²
73 
195 
195 
200 
222 
237 
240