emooki
HomePrice mapTransactions
🇬🇧 English🇫🇷 Français🇩🇪 Deutsch🇪🇸 Español🇮🇹 Italiano

Real estate price map


Real estate price map in the municipality of Viry, choose a section to see transactions by parcel.

Jura (39)

Viry - Real estate price m²

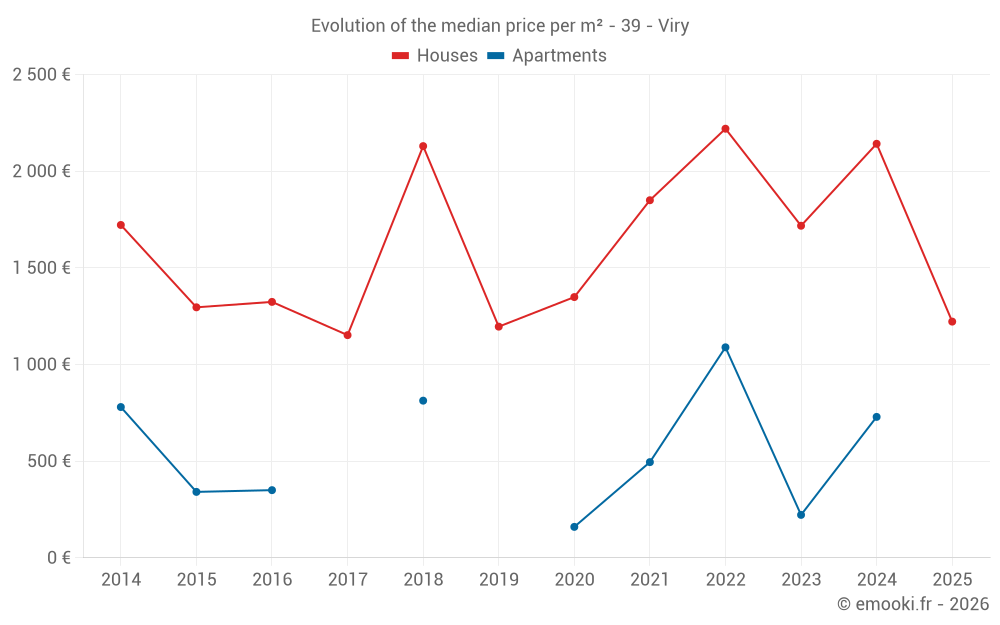
Median price of real estate
in the municipality of Viry

HousesHouses
1 513  /m²
1-23-45-67-89-10
Reliability 7/10
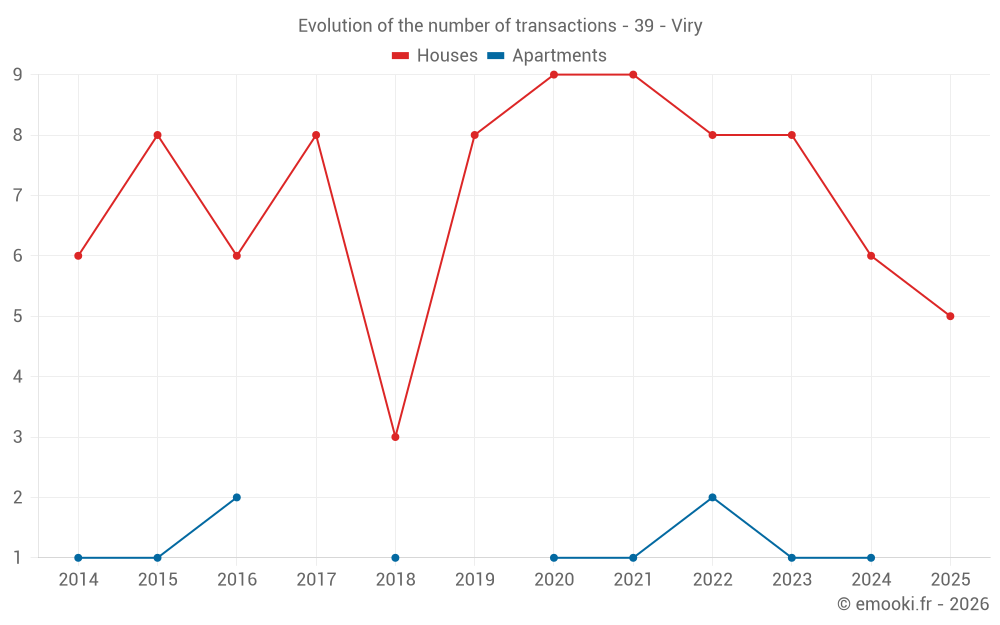
Median price on the 14 transactions of the last 24 months.
from 1 096 to
2 418  /m²
60% of transactions from the 2nd to the 8th deciles.
ApartmentsApartments
452  /m²
1-23-45-67-89-10
Reliability 3/10
Median price on the 6 transactions of the last 72 months.
DwellingsDwellings
1 346  /m²
1-23-45-67-89-10
Reliability 7/10
Median price on the 16 transactions of the last 24 months.
from 933 to
2 390  /m²
60% of transactions from the 2nd to the 8th deciles.
HousesEvolution of the price per m² of houses since...
1 year
-43%
2 years
-29%
3 years
-45%
4 years
-34%
5 years
-9.4%
6 years
+2.2%
7 years
--
8 years
+6.1%
9 years
-7.7%
10 years
-5.7%
11 years
-29%
The price per m² of houses has decreased by 45% since 3 years, but it has increased by 6.1% in 8 years.

Yearly evolution

Evolution of the median price per m²

Evolution of the median price per m² - 39 - Viry

Evolution of the number of transactions

Warning, last year incomplete. Projections made based on the proportions between semesters of the previous year at the departmental/national level and by type of property.

Evolution of the number of transactions - 39 - Viry

Yearly data

Descending order
Year
Houses
house
transactions
Houses
house
Price per m²
Apartments
apt.
transactions
Apartments
apt.
Price per m²
2025
5
1 222 
0
--- 
2024
6
2 142 
1
729 
2023
8
1 718 
1
222 
2022
8
2 220 
2
1 089 
2021
9
1 850 
1
495 
2020
9
1 349 
1
160 
2019
8
1 196 
0
--- 
2018
3
2 130 
1
813 
2017
8
1 152 
0
--- 
2016
6
1 324 
2
350 
2015
8
1 296 
1
341 
2014
6
1 722 
1
780 

Analysis

Structure of prices per m²

Values of price percentiles per m² over the periods used for the estimated price of each type of property.

Structure of transaction amounts

Values of transaction amounts percentiles over the periods used for the estimated price of each type of property.

Transaction amounts and prices per m² by percentile

Ascending order
Percentile
Houses
house
Price per m²
Houses
house
Transaction amount
Apartments
apt.
Price per m²
Apartments
apt.
Transaction amount
10th percentile
950 
99 500 
191 
32 500 
20th percentile
1 096 
149 K
222 
40 000 
30th percentile
1 216 
218 K
316 
60 000 
40th percentile
1 318 
227 K
410 
80 000 
50th percentile
1 513 
235 K
452 
95 000 
60th percentile
1 719 
259 K
495 
110 K
70th percentile
1 943 
271 K
612 
125 K
80th percentile
2 418 
310 K
729 
140 K
90th percentile
2 518 
321 K
1 248 
238 K

National and departmental comparison

Evolution of the median price per m² of houses

Evolution of the median price per m² of apartments

Quarterly evolution

Evolution of the median price per m²

Evolution of the number of transactions

Quarterly data

Descending order
Quarter
Houses
house
transactions
Houses
house
Price per m²
Apartments
apt.
transactions
Apartments
apt.
Price per m²
2025 Q1
5
1 222 
0
--- 
2024 Q4
2
1 530 
0
--- 
2024 Q3
3
2 390 
1
729 
2024 Q1
1
2 543 
0
--- 
2023 Q4
1
1 299 
0
--- 
2023 Q3
2
1 282 
1
222 
2023 Q2
4
2 108 
0
--- 
2023 Q1
1
2 391 
0
--- 
2022 Q4
2
1 700 
1
1 768 
2022 Q3
3
2 620 
1
410 
2022 Q2
2
2 220 
0
--- 
2022 Q1
1
1 995 
0
--- 
2021 Q4
1
3 270 
0
--- 
2021 Q3
3
1 465 
0
--- 
2021 Q2
4
2 064 
1
495 
2021 Q1
1
862 
0
--- 
2020 Q4
3
947 
0
--- 
2020 Q3
3
1 071 
1
160 
2020 Q2
2
1 960 
0
--- 
2020 Q1
1
1 349 
0
--- 
2019 Q4
1
1 212 
0
--- 
2019 Q3
4
1 165 
0
--- 
2019 Q2
2
1 852 
0
--- 
2019 Q1
1
855 
0
--- 
2018 Q4
1
2 130 
0
--- 
2018 Q2
2
2 409 
0
--- 
2018 Q1
0
--- 
1
813 
2017 Q3
3
739 
0
--- 
2017 Q2
3
1 205 
0
--- 
2017 Q1
2
1 433 
0
--- 
2016 Q4
5
1 184 
0
--- 
2016 Q3
1
2 249 
1
541 
2016 Q1
0
--- 
1
160 
2015 Q4
1
963 
0
--- 
2015 Q3
4
1 636 
1
341 
2015 Q2
3
650 
0
--- 
2014 Q4
2
1 673 
0
--- 
2014 Q3
1
1 963 
0
--- 
2014 Q2
3
1 680 
1
780 

Overview of the latest real estate transactions

The following list is an anonymized overview of the latest transactions. For more details and to find all transactions, please use the map to view transactions by plot or the transaction search page for a search by criteria.

2025-05-26
18 000 
Sale
Land
300 m2
-Prés
2025-04-11
6 151 
Sale
Land
600 m2
-Taillis simples
Land
1380 m2
-Prés
Land
720 m2
-Taillis simples
/Broussailles ou buissons
Land
990 m2
-Taillis simples
Land
930 m2
-Taillis simples
Land
14020 m2
-Taillis simples
Land
1300 m2
-Taillis simples
Land
2130 m2
-Futaies résineuses
Land
415 m2
-Taillis simples
Land
4470 m2
-Taillis simples
/Broussailles ou buissons
Land
540 m2
-Taillis simples
Land
18718 m2
-Taillis simples
2025-04-02
100 
Sale
Land
33 m2
-Sols
2025-03-28
14 000 
Sale
1 outbuilding
Land
496 m2
-Sols
Land
57 m2
-Sols
2025-03-28
69 000 
556  /m²(124 m²)
Sale
Houses
House
5 rooms
124 m2
Land
160 m2
-Sols
2025-03-21
38 000 
Sale
2 outbuildings
Land
285 m2
-Sols
2025-03-21
95 000 
990  /m²(96 m²)
Sale
Houses
House
5 rooms
96 m2
2 outbuildings
Land
700 m2
-Sols
Land
757 m2
-Prés
2025-03-14
235 000 
1 741  /m²(135 m²)
Sale
Houses
House
6 rooms
135 m2
Land
1115 m2
-Sols
Land
370 m2
-Sols
2025-02-27
110 000 
1 222  /m²(90 m²)
Sale
Houses
House
4 rooms
90 m2
1 outbuilding
Land
1147 m2
-Sols
2025-02-19
200 
Sale
Land
2640 m2
-Prés
2025-02-19
1 200 
Sale
Land
2495 m2
-Prés
Land
1736 m2
-Terres
2025-02-07
343 000 
2 789  /m²(123 m²)
Sale
Houses
House
4 rooms
123 m2
Land
1210 m2
-Sols
2025-01-29
400 
Sale
Land
3750 m2
-Prés
2024-12-30
265 000 
1 893  /m²(140 m²)
Sale
Houses
House
5 rooms
140 m2
Land
937 m2
-Sols
2024-12-20
1 700 
Sale
Land
1278 m2
-Futaies résineuses
Land
2639 m2
-Prés
2024-12-13
1 110 
Sale
Land
105 m2
-Prés
Land
60 m2
-Prés
2024-10-17
800 
Sale
Land
3980 m2
-Taillis simples
/Broussailles ou buissons
2024-10-10
175 000 
1 167  /m²(150 m²)
Sale
Houses
House
4 rooms
150 m2
Land
14433 m2
-Prés
Land
1422 m2
-Sols
2024-10-03
10 000 
Sale
Land
16626 m2
-Futaies résineuses
Land
1546 m2
-Futaies résineuses
Land
3094 m2
-Taillis simples
2024-09-30
223 000 
1 394  /m²(160 m²)
Sale
Houses
House
5 rooms
160 m2
Land
370 m2
-Sols
Land
30 m2
-Sols
Land
132 m2
-Sols
230 transactions listed in the municipality

Jura (39)

Most expensive cities

City
name
Descending orderHouses
house
Price per m²
4 238 
3 961 
3 877 
3 513 
3 178 
3 007 
2 996 
2 918 
2 846 
City
name
Descending orderApartments
apt.
Price per m²
3 853 
3 456 
2 982 
2 732 
2 583 
2 511 
2 361 
2 286 
2 276 

Least expensive cities

City
name
Ascending orderHouses
house
Price per m²
381 
417 
462 
466 
539 
544 
628 
City
name
Ascending orderApartments
apt.
Price per m²
73 
195 
195 
200 
222 
237 
240