emooki
HomePrice mapTransactions
🇬🇧 English🇫🇷 Français🇩🇪 Deutsch🇪🇸 Español🇮🇹 Italiano

Real estate price map


Real estate price map in the municipality of Saint-Lothain, choose a section to see transactions by parcel.

Jura (39)

Saint-Lothain - Real estate price m²

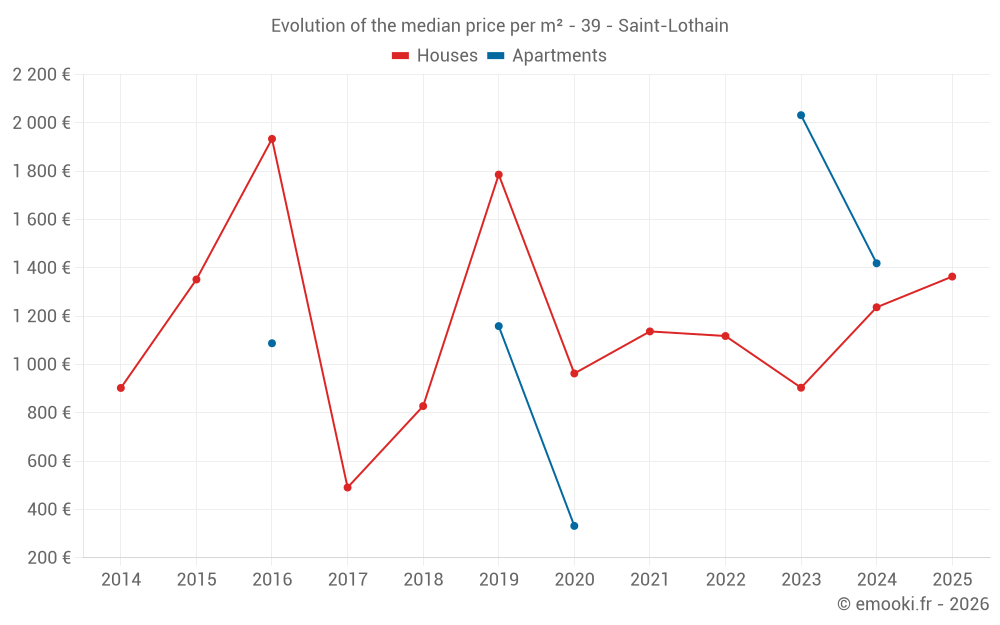
Median price of real estate
in the municipality of Saint-Lothain

HousesHouses
1 256  /m²
1-23-45-67-89-10
Reliability 6/10
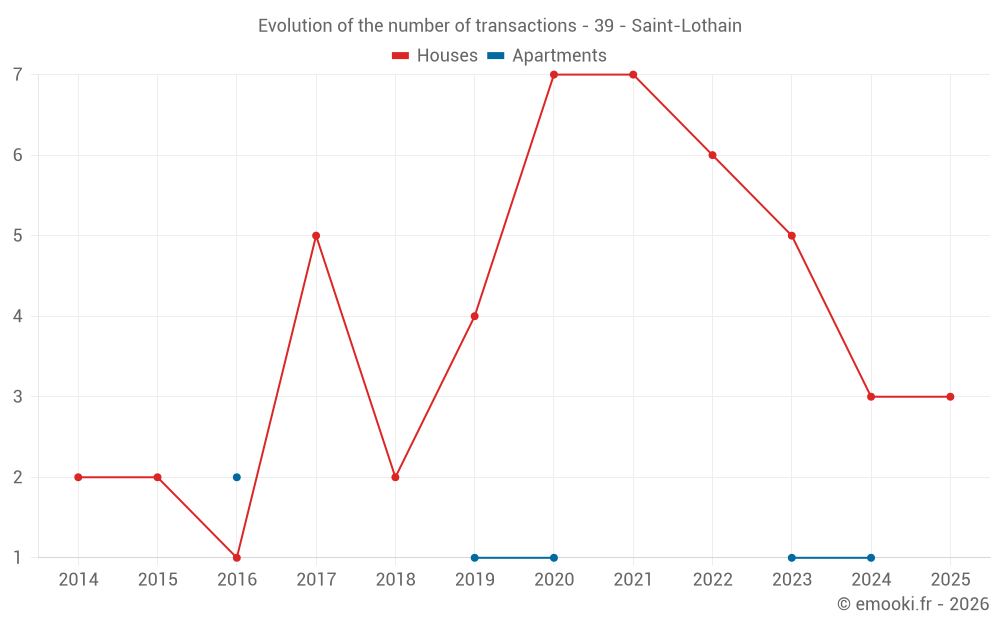
Median price on the 16 transactions of the last 36 months.
from 756 to
1 469  /m²
60% of transactions from the 2nd to the 8th deciles.
ApartmentsApartments
1 289  /m²
1-23-45-67-89-10
Reliability 2/10
Median price on the 4 transactions of the last 96 months.
DwellingsDwellings
1 296  /m²
1-23-45-67-89-10
Reliability 6/10
Median price on the 18 transactions of the last 36 months.
from 757 to
1 588  /m²
60% of transactions from the 2nd to the 8th deciles.

Yearly evolution

Evolution of the median price per m²

Evolution of the median price per m² - 39 - Saint-Lothain

Evolution of the number of transactions

Warning, last year incomplete. Projections made based on the proportions between semesters of the previous year at the departmental/national level and by type of property.

Evolution of the number of transactions - 39 - Saint-Lothain

Yearly data

Descending order
Year
Houses
house
transactions
Houses
house
Price per m²
Apartments
apt.
transactions
Apartments
apt.
Price per m²
2025
3
1 364 
0
--- 
2024
3
1 237 
1
1 419 
2023
5
904 
1
2 032 
2022
6
1 118 
0
--- 
2021
7
1 137 
0
--- 
2020
7
963 
1
332 
2019
4
1 786 
1
1 159 
2018
2
828 
0
--- 
2017
5
491 
0
--- 
2016
1
1 934 
2
1 088 
2015
2
1 352 
0
--- 
2014
2
903 
0
--- 

Analysis

Structure of prices per m²

Values of price percentiles per m² over the periods used for the estimated price of each type of property.

Structure of transaction amounts

Values of transaction amounts percentiles over the periods used for the estimated price of each type of property.

Transaction amounts and prices per m² by percentile

Ascending order
Percentile
Houses
house
Price per m²
Houses
house
Transaction amount
Apartments
apt.
Price per m²
Apartments
apt.
Transaction amount
10th percentile
556 
50 000 
580 
127 K
20th percentile
756 
59 000 
828 
167 K
30th percentile
832 
72 500 
1 076 
207 K
40th percentile
1 212 
96 500 
1 211 
239 K
50th percentile
1 256 
122 K
1 289 
269 K
60th percentile
1 315 
148 K
1 367 
298 K
70th percentile
1 408 
180 K
1 480 
323 K
80th percentile
1 469 
189 K
1 664 
339 K
90th percentile
1 682 
229 K
1 848 
356 K

National and departmental comparison

Evolution of the median price per m² of houses

Evolution of the median price per m² of apartments

Quarterly evolution

Evolution of the median price per m²

Evolution of the number of transactions

Quarterly data

Descending order
Quarter
Houses
house
transactions
Houses
house
Price per m²
Apartments
apt.
transactions
Apartments
apt.
Price per m²
2025 Q2
2
1 062 
0
--- 
2025 Q1
1
1 698 
0
--- 
2024 Q4
2
1 224 
0
--- 
2024 Q3
1
1 315 
0
--- 
2024 Q1
0
--- 
1
1 419 
2023 Q4
1
904 
1
2 032 
2023 Q3
3
1 452 
0
--- 
2023 Q1
1
455 
0
--- 
2022 Q4
3
1 276 
0
--- 
2022 Q3
2
1 212 
0
--- 
2022 Q2
1
961 
0
--- 
2021 Q4
2
1 826 
0
--- 
2021 Q3
4
1 124 
0
--- 
2021 Q1
1
553 
0
--- 
2020 Q4
3
509 
1
332 
2020 Q3
1
1 654 
0
--- 
2020 Q2
1
513 
0
--- 
2020 Q1
2
1 000 
0
--- 
2019 Q3
3
1 644 
0
--- 
2019 Q2
1
1 927 
0
--- 
2019 Q1
0
--- 
1
1 159 
2018 Q3
1
875 
0
--- 
2018 Q2
1
782 
0
--- 
2017 Q4
1
361 
0
--- 
2017 Q3
1
782 
0
--- 
2017 Q2
3
491 
0
--- 
2016 Q2
0
--- 
2
1 088 
2016 Q1
1
1 934 
0
--- 
2015 Q4
1
610 
0
--- 
2015 Q3
1
2 095 
0
--- 
2014 Q4
2
903 
0
--- 

Overview of the latest real estate transactions

The following list is an anonymized overview of the latest transactions. For more details and to find all transactions, please use the map to view transactions by plot or the transaction search page for a search by criteria.

2025-06-24
1 200 
Sale
Land
2988 m2
-Terres
Land
1495 m2
-Prés
2025-06-12
39 000 
Sale
Land
1420 m2
-Prés
2025-05-05
2 000 
Sale
Land
673 m2
-Sols
2025-04-28
420 000 
1 364  /m²(308 m²)
Sale
Houses
House
9 rooms
308 m2
Land
545 m2
-Sols
Land
1445 m2
-Jardins
2025-04-23
3 500 
Sale
Land
2908 m2
-Terres
2025-04-16
60 000 
759  /m²(79 m²)
Sale
Houses
House
3 rooms
79 m2
1 outbuilding
Land
150 m2
-Sols
Land
27 m2
-Sols
Land
150 m2
-Sols
Land
196 m2
-Jardins
2025-03-24
4 000 
Sale
Land
1237 m2
-Taillis simples
Land
2380 m2
-Taillis simples
Land
2080 m2
-Prés
Land
1480 m2
-Taillis simples
Land
3370 m2
-Futaies résineuses
Land
8880 m2
-Taillis simples
Land
2437 m2
-Taillis simples
2025-01-22
450 
Sale
Land
950 m2
-Taillis simples
2025-01-10
5 700 
Sale
Land
2037 m2
-Taillis simples
Land
15771 m2
-Prés
Land
5257 m2
-Terres
Land
1480 m2
-Taillis simples
Land
3571 m2
-Prés
Land
511 m2
-Peupleraies
Land
1071 m2
-Taillis simples
2025-01-10
180 000 
1 698  /m²(106 m²)
Sale
Houses
House
5 rooms
106 m2
Land
1124 m2
-Sols
Land
1625 m2
-Futaies résineuses
Land
299 m2
-Vergers
2024-12-17
300 
Sale
Land
1940 m2
-Taillis simples
2024-12-17
4 800 
Sale
Land
10324 m2
-Terres
Land
4473 m2
-Terres
Land
7443 m2
-Prés
Land
1000 m2
-Taillis simples
2024-12-03
35 000 
Sale
Land
6091 m2
-Terres
2024-11-28
500 
Sale
Land
513 m2
-Taillis sous futaie
Land
2137 m2
-Taillis simples
Land
382 m2
-Taillis simples
2024-11-25
220 000 
1 038  /m²(212 m²)
1 447  /m²(152 m²)
Sale
Houses
House
6 rooms
152 m2
1 outbuilding
Land
1188 m2
-Sols
Commercial property
60 m2
Land
199 m2
-Sols
2024-11-08
96 500 
1 237  /m²(78 m²)
Sale
Houses
House
4 rooms
78 m2
Land
227 m2
-Sols
2024-11-06
1 300 
Sale
Land
2039 m2
-Taillis simples
Land
757 m2
-Taillis simples
Land
404 m2
-Taillis simples
Land
260 m2
-Taillis simples
Land
795 m2
-Taillis simples
Land
1285 m2
-Prés
2024-11-06
200 000 
1 212  /m²(165 m²)
Sale
Houses
House
8 rooms
165 m2
2 outbuildings
Land
724 m2
-Sols
Land
887 m2
-Jardins
2024-10-23
801 
Sale
Land
915 m2
-Prés
Land
1832 m2
-Prés
Land
1705 m2
-Vergers
2024-10-23
288 
Sale
Land
1598 m2
-Vergers
197 transactions listed in the municipality

Jura (39)

Most expensive cities

City
name
Descending orderHouses
house
Price per m²
4 238 
3 961 
3 877 
3 513 
3 178 
3 007 
2 996 
2 918 
2 846 
City
name
Descending orderApartments
apt.
Price per m²
3 853 
3 456 
2 982 
2 732 
2 583 
2 511 
2 361 
2 286 
2 276 

Least expensive cities

City
name
Ascending orderHouses
house
Price per m²
381 
417 
462 
466 
539 
544 
628 
City
name
Ascending orderApartments
apt.
Price per m²
73 
195 
195 
200 
222 
237 
240