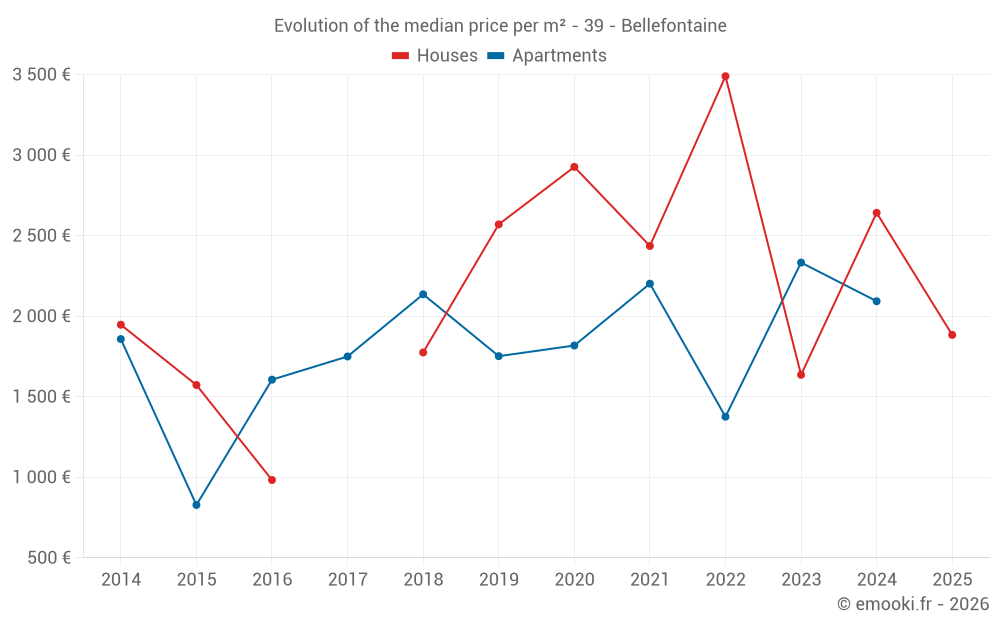
Median price of real estate
in the municipality of Bellefontaine
Houses
2 577 € /m²
Reliability 6/10
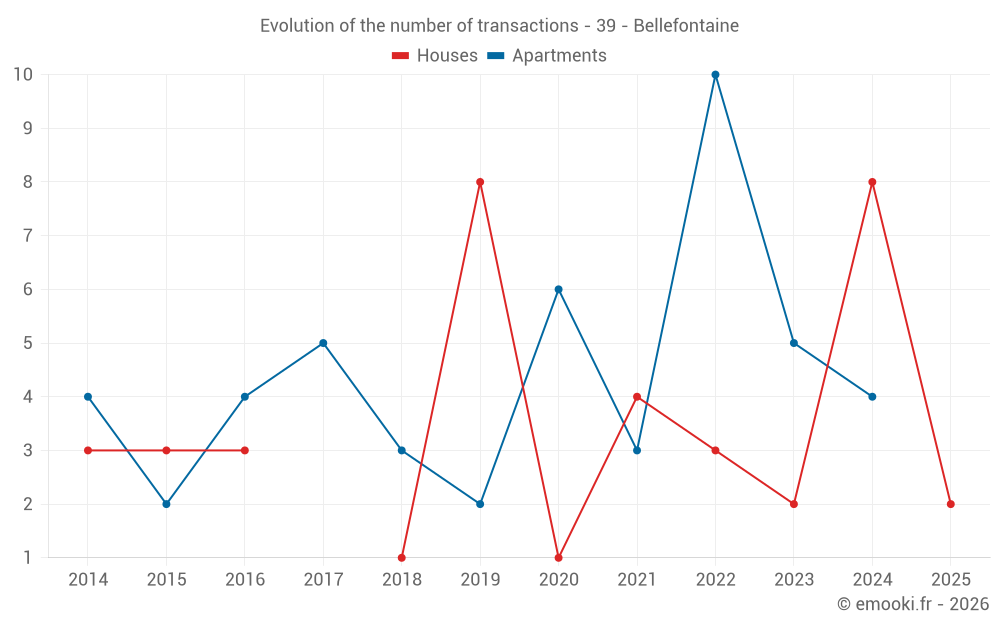
Median price on the 13 transactions of the last 36 months.
from 1 422 to
3 486 € /m²
3 486 € /m²
60% of transactions from the 2nd to the 8th deciles.
Apartments
1 857 € /m²
Reliability 6/10
Median price on the 13 transactions of the last 36 months.
from 1 333 to
2 662 € /m²
2 662 € /m²
60% of transactions from the 2nd to the 8th deciles.
Dwellings
2 569 € /m²
Reliability 7/10
Median price on the 18 transactions of the last 24 months.
from 1 419 to
3 182 € /m²
3 182 € /m²
60% of transactions from the 2nd to the 8th deciles.