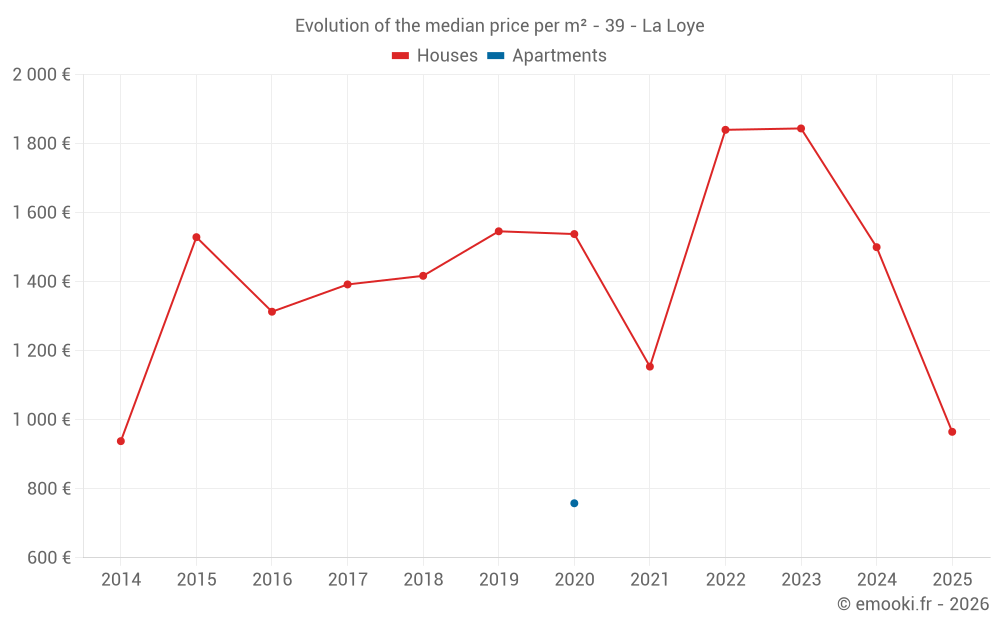
Median price of real estate
in the municipality of La Loye
Houses
1 840 € /m²
Reliability 6/10
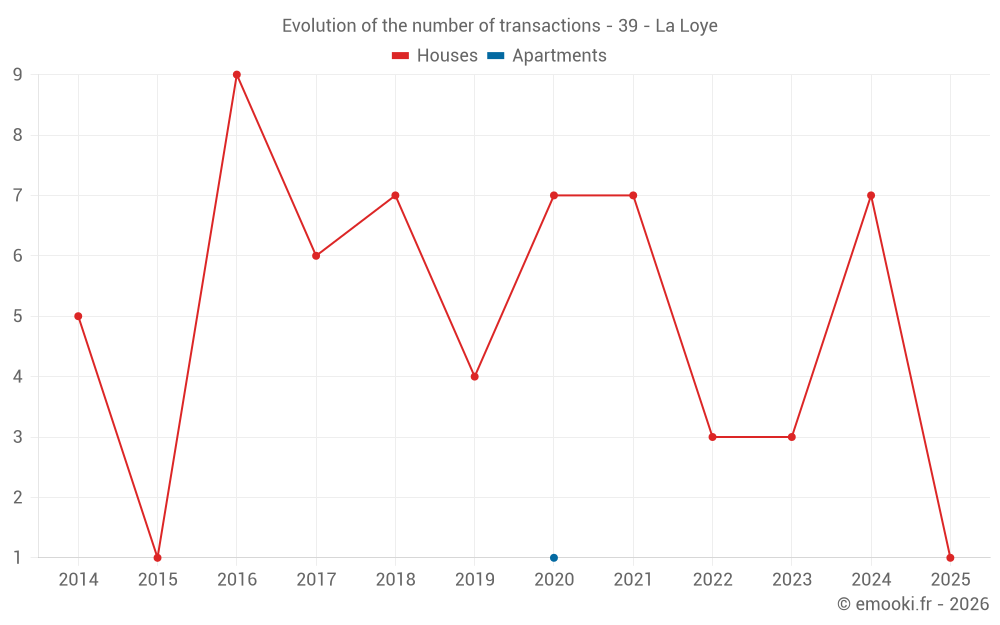
Median price on the 13 transactions of the last 36 months.
from 1 063 to
2 238 € /m²
2 238 € /m²
60% of transactions from the 2nd to the 8th deciles.
Apartments
758 € /m²
Reliability 1/10
Price of the unique transaction of the last 120 months.
Dwellings
1 840 € /m²
Reliability 6/10
Median price on the 13 transactions of the last 36 months.
from 1 063 to
2 238 € /m²
2 238 € /m²
60% of transactions from the 2nd to the 8th deciles.