emooki
HomePrice mapTransactions
🇬🇧 English🇫🇷 Français🇩🇪 Deutsch🇪🇸 Español🇮🇹 Italiano

Real estate price map


Real estate price map in the municipality of Présilly.

Jura (39)
Présilly

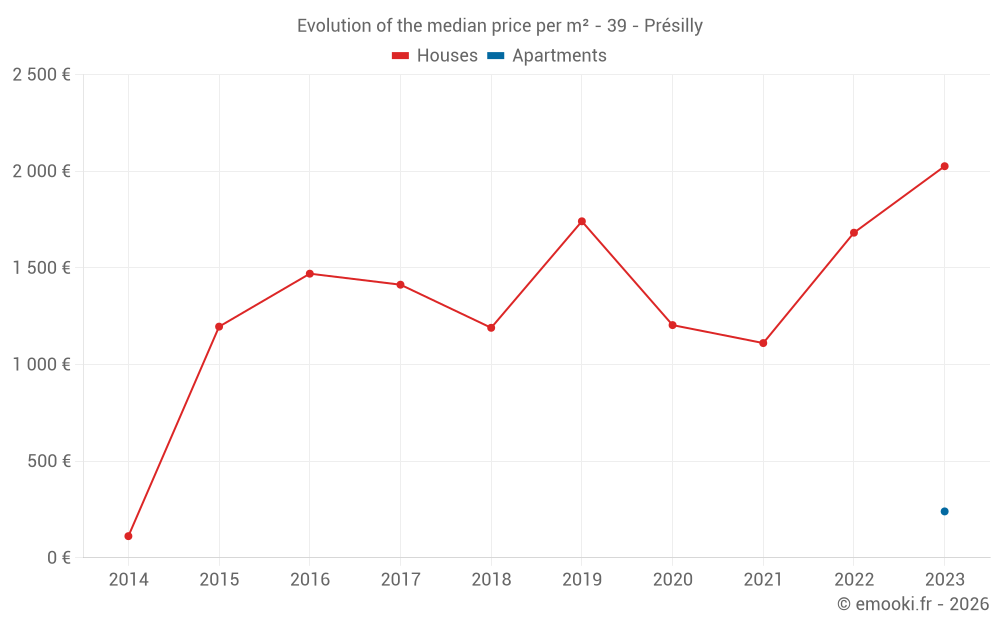
Median price of real estate
in the municipality of Présilly

HousesHouses
1 454  /m²
1-23-45-67-89-10
Reliability 4/10
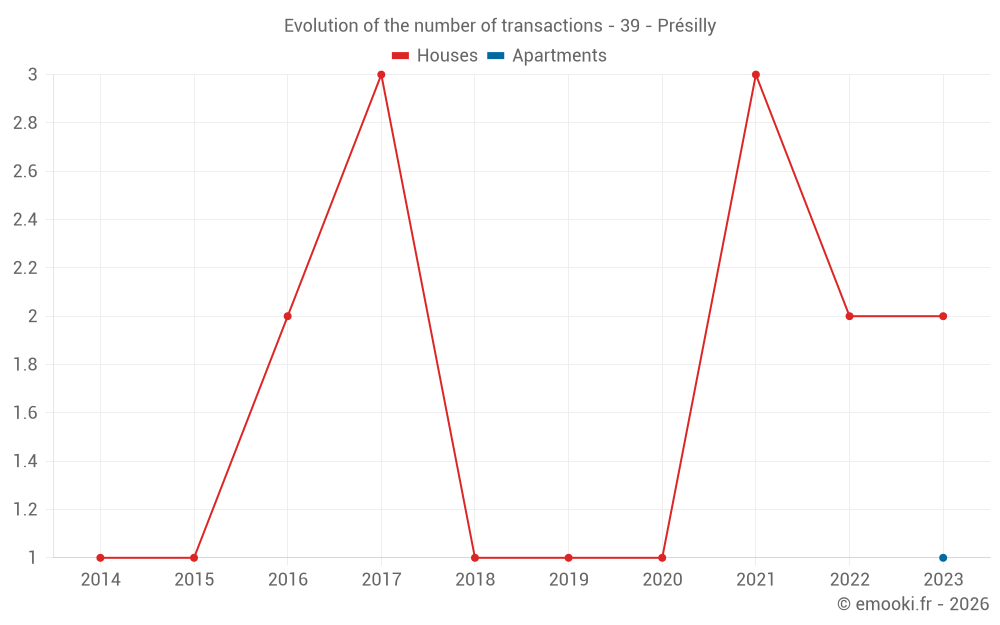
Median price on the 8 transactions of the last 60 months.
ApartmentsApartments
240  /m²
1-23-45-67-89-10
Reliability 1/10
Price of the unique transaction of the last 120 months.
DwellingsDwellings
1 422  /m²
1-23-45-67-89-10
Reliability 4/10
Median price on the 9 transactions of the last 60 months.
HousesEvolution of the price per m² of houses since...
1 year
--
2 years
--
3 years
--
4 years
--
5 years
--
6 years
--
7 years
--
8 years
--
9 years
--
10 years
--
11 years
--
ApartmentsEvolution of the price per m² of apartments since...
1 year
--
2 years
--
3 years
--
4 years
--
5 years
--
6 years
--
7 years
--
8 years
--
9 years
--
10 years
--
11 years
--

Yearly evolution

Evolution of the median price per m²

Evolution of the number of transactions

Warning, last year incomplete.

Yearly data

Descending order
Year
Houses
house
transactions
Houses
house
Price per m²
Apartments
apt.
transactions
Apartments
apt.
Price per m²
2025
0
--- 
0
--- 
2024
0
--- 
0
--- 
2023
2
2 026 
1
240 
2022
2
1 682 
0
--- 
2021
3
1 111 
0
--- 
2020
1
1 204 
0
--- 
2019
1
1 741 
0
--- 
2018
1
1 190 
0
--- 
2017
3
1 413 
0
--- 
2016
2
1 470 
0
--- 
2015
1
1 196 
0
--- 
2014
1
112 
0
--- 

Analysis

Structure of prices per m²

Values of price percentiles per m² over the periods used for the estimated price of each type of property.

Structure of transaction amounts

Values of transaction amounts percentiles over the periods used for the estimated price of each type of property.

Transaction amounts and prices per m² by percentile

Ascending order
Percentile
Houses
house
Price per m²
Houses
house
Transaction amount
Apartments
apt.
Price per m²
Apartments
apt.
Transaction amount
10th percentile
1 052 
91 570 
240 
23 000 
20th percentile
1 148 
101 K
240 
23 000 
30th percentile
1 226 
116 K
240 
23 000 
40th percentile
1 378 
133 K
240 
23 000 
50th percentile
1 454 
141 K
240 
23 000 
60th percentile
1 514 
153 K
240 
23 000 
70th percentile
1 615 
179 K
240 
23 000 
80th percentile
1 779 
227 K
240 
23 000 
90th percentile
2 104 
268 K
240 
23 000 

National and departmental comparison

Evolution of the median price per m² of houses

Evolution of the median price per m² of apartments

Quarterly evolution

Evolution of the median price per m²

Evolution of the number of transactions

Quarterly data

Descending order
Quarter
Houses
house
transactions
Houses
house
Price per m²
Apartments
apt.
transactions
Apartments
apt.
Price per m²
2023 Q4
2
2 026 
0
--- 
2023 Q1
0
--- 
1
240 
2022 Q4
1
1 879 
0
--- 
2022 Q2
1
1 485 
0
--- 
2021 Q4
1
916 
0
--- 
2021 Q1
2
1 370 
0
--- 
2020 Q4
1
1 204 
0
--- 
2019 Q1
1
1 741 
0
--- 
2018 Q2
1
1 190 
0
--- 
2017 Q2
2
1 474 
0
--- 
2017 Q1
1
1 014 
0
--- 
2016 Q4
1
1 176 
0
--- 
2016 Q3
1
1 764 
0
--- 
2015 Q4
1
1 196 
0
--- 
2014 Q4
1
112 
0
--- 

Jura (39)

Most expensive cities

City
name
Descending orderHouses
house
Price per m²
4 238 
3 961 
3 877 
3 513 
3 178 
3 007 
2 996 
2 918 
2 846 
City
name
Descending orderApartments
apt.
Price per m²
3 853 
3 456 
2 982 
2 732 
2 583 
2 511 
2 361 
2 286 
2 276 

Least expensive cities

City
name
Ascending orderHouses
house
Price per m²
381 
417 
462 
466 
539 
544 
628 
City
name
Ascending orderApartments
apt.
Price per m²
73 
195 
195 
200 
222 
237 
240