emooki
HomePrice mapTransactions
🇬🇧 English🇫🇷 Français🇩🇪 Deutsch🇪🇸 Español🇮🇹 Italiano

Real estate price map


Real estate price map in the municipality of Cernans, choose a section to see transactions by parcel.

Jura (39)

Cernans - Real estate price m²

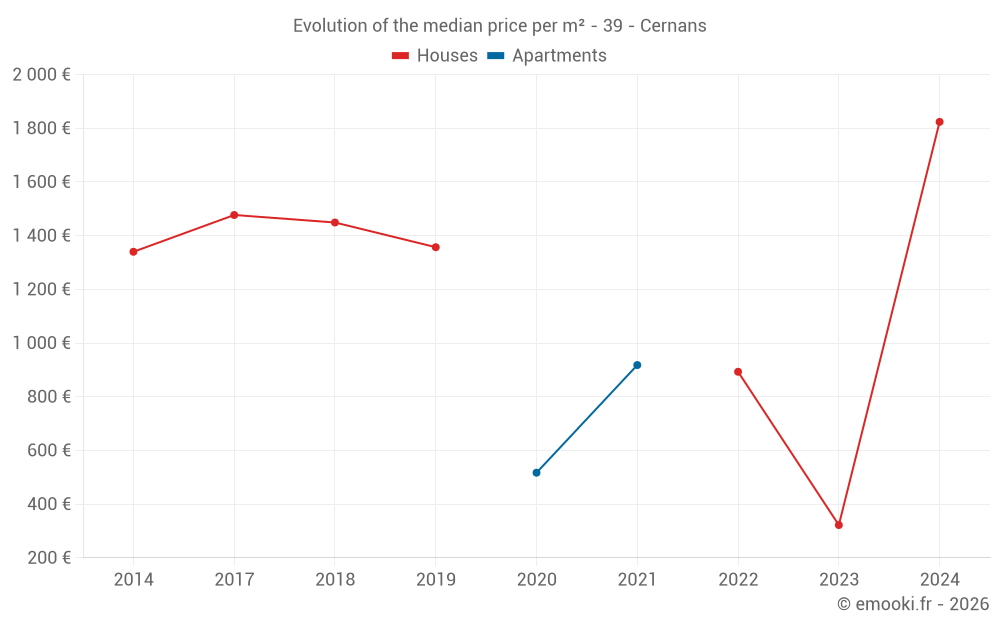
Median price of real estate
in the municipality of Cernans

HousesHouses
1 478  /m²
1-23-45-67-89-10
Reliability 3/10
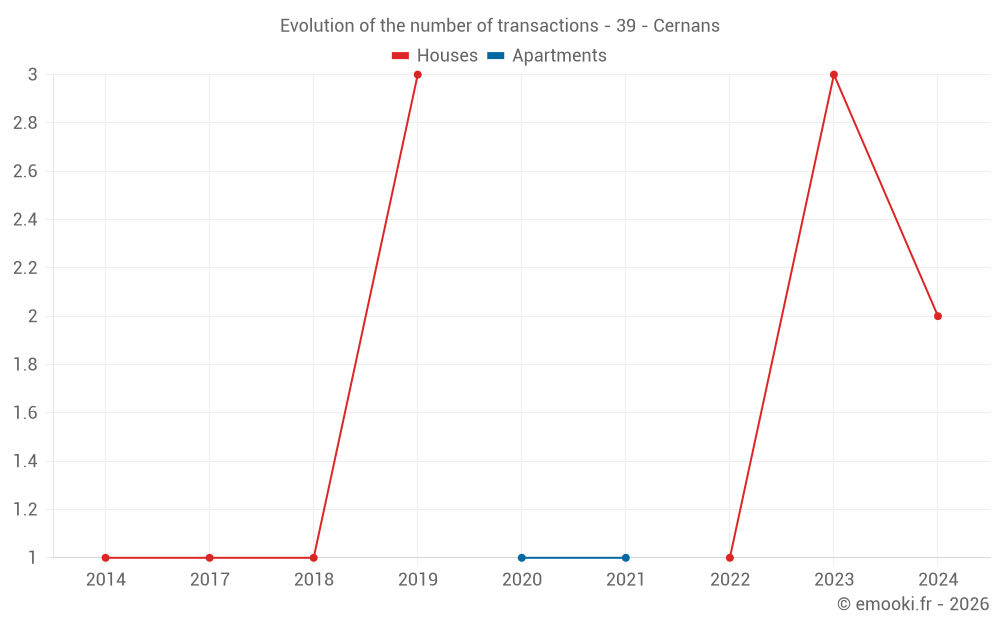
Median price on the 7 transactions of the last 72 months.
ApartmentsApartments
718  /m²
1-23-45-67-89-10
Reliability 1/10
Median price on the 2 transactions of the last 120 months.
DwellingsDwellings
906  /m²
1-23-45-67-89-10
Reliability 4/10
Median price on the 8 transactions of the last 60 months.

Yearly evolution

Evolution of the median price per m²

Evolution of the median price per m² - 39 - Cernans

Evolution of the number of transactions

Warning, last year incomplete. Projections made based on the proportions between semesters of the previous year at the departmental/national level and by type of property.

Evolution of the number of transactions - 39 - Cernans

Yearly data

Descending order
Year
Houses
house
transactions
Houses
house
Price per m²
Apartments
apt.
transactions
Apartments
apt.
Price per m²
2025
0
--- 
0
--- 
2024
2
1 824 
0
--- 
2023
3
322 
0
--- 
2022
1
893 
0
--- 
2021
0
--- 
1
918 
2020
0
--- 
1
517 
2019
3
1 357 
0
--- 
2018
1
1 449 
0
--- 
2017
1
1 477 
0
--- 
2016
0
--- 
0
--- 
2015
0
--- 
0
--- 
2014
1
1 340 
0
--- 

Analysis

Structure of prices per m²

Values of price percentiles per m² over the periods used for the estimated price of each type of property.

Structure of transaction amounts

Values of transaction amounts percentiles over the periods used for the estimated price of each type of property.

Transaction amounts and prices per m² by percentile

Ascending order
Percentile
Houses
house
Price per m²
Houses
house
Transaction amount
Apartments
apt.
Price per m²
Apartments
apt.
Transaction amount
10th percentile
265 
23 880 
557 
152 K
20th percentile
436 
38 200 
597 
154 K
30th percentile
779 
65 800 
637 
156 K
40th percentile
1 127 
98 200 
677 
158 K
50th percentile
1 478 
133 K
718 
160 K
60th percentile
1 537 
173 K
758 
161 K
70th percentile
1 676 
204 K
798 
163 K
80th percentile
1 972 
215 K
838 
165 K
90th percentile
2 293 
243 K
878 
167 K

National and departmental comparison

Evolution of the median price per m² of houses

Evolution of the median price per m² of apartments

Quarterly evolution

Evolution of the median price per m²

Evolution of the number of transactions

Quarterly data

Descending order
Quarter
Houses
house
transactions
Houses
house
Price per m²
Apartments
apt.
transactions
Apartments
apt.
Price per m²
2024 Q3
1
1 577 
0
--- 
2024 Q1
1
2 071 
0
--- 
2023 Q3
1
2 626 
0
--- 
2023 Q1
2
251 
0
--- 
2022 Q2
1
893 
0
--- 
2021 Q4
0
--- 
1
918 
2020 Q3
0
--- 
1
517 
2019 Q4
1
1 478 
0
--- 
2019 Q2
1
310 
0
--- 
2019 Q1
1
1 357 
0
--- 
2018 Q4
1
1 449 
0
--- 
2017 Q3
1
1 477 
0
--- 
2014 Q3
1
1 340 
0
--- 

Overview of the latest real estate transactions

The following list is an anonymized overview of the latest transactions. For more details and to find all transactions, please use the map to view transactions by plot or the transaction search page for a search by criteria.

2025-02-28
110 
Sale
Land
22 m2
-Sols
2025-02-17
18 000 
Sale
Land
2244 m2
-Terres
2025-02-11
13 896 
Sale
Land
9 m2
-Terres
Land
27 m2
-Terres
Land
720 m2
-Terrains à bâtir
Land
777 m2
-Terrains à bâtir
Land
204 m2
-Terrains à bâtir
2025-02-11
7 696 
Sale
Land
950 m2
-Terrains à bâtir
Land
12 m2
-Terrains à bâtir
2025-01-20
2 352 
Sale
Land
2352 m2
-Terres
2024-08-30
219 200 
1 577  /m²(139 m²)
Sale
Houses
House
5 rooms
139 m2
Land
1795 m2
-Sols
Land
5920 m2
-Terres
Land
337 m2
-Terres
2024-03-27
277 500 
2 071  /m²(134 m²)
Sale
Houses
House
4 rooms
134 m2
Land
22985 m2
-Terres
Land
2785 m2
-Sols
Land
11493 m2
-Terres
Land
22007 m2
-Terres
Land
11003 m2
-Terres
Land
31187 m2
-Terres
Land
7095 m2
-Prés
Land
1818 m2
-Taillis simples
2024-03-27
503 000 
Sale
Land
5130 m2
-Sols
Land
5027 m2
-Terres
2024-03-13
95 000 
409  /m²(232 m²)
720  /m²(132 m²)
Sale
Houses
House
3 rooms
132 m2
Commercial property
100 m2
Land
339 m2
-Sols
2023-10-19
31 802 
Sale
Land
14730 m2
-Terres
Land
17938 m2
-Terres
Land
48363 m2
-Terres
Land
12091 m2
-Terres
Land
15463 m2
-Terres
2023-10-09
1 320 
Sale
Land
6197 m2
-Taillis sous futaie
Land
6993 m2
-Taillis sous futaie
2023-09-14
199 600 
2 626  /m²(76 m²)
Sale
Houses
House
3 rooms
76 m2
Land
938 m2
-Sols
2023-06-07
7 000 
Sale
Land
10610 m2
-Futaies résineuses
Land
6140 m2
-Futaies résineuses
2023-01-31
29 000 
322  /m²(90 m²)
Sale
Houses
House
1 room
90 m2
Land
517 m2
-Sols
2023-01-06
16 200 
180  /m²(90 m²)
Sale
Houses
House
1 room
90 m2
Land
517 m2
-Sols
2022-11-15
23 950 
Sale
Land
3070 m2
-Terres
Land
11787 m2
-Terres
Land
23576 m2
-Terres
Land
18436 m2
-Terres
Land
9217 m2
-Terres
2022-09-15
500 
Sale
Land
202 m2
-Sols
2022-08-18
120 000 
267  /m²(450 m²)
Sale
Commercial property
450 m2
Land
1428 m2
-Sols
Land
290 m2
-Sols
Land
211 m2
-Sols
Land
105 m2
-Sols
Land
392 m2
-Sols
2022-06-24
75 000 
893  /m²(84 m²)
Sale
1 outbuilding
Land
100 m2
-Sols
Houses
House
3 rooms
84 m2
Land
272 m2
-Sols
Land
15 m2
-Sols
2022-05-20
25 150 
Sale
Land
1006 m2
-Terrains à bâtir
45 transactions listed in the municipality

Jura (39)

Most expensive cities

City
name
Descending orderHouses
house
Price per m²
4 238 
3 961 
3 877 
3 513 
3 178 
3 007 
2 996 
2 918 
2 846 
City
name
Descending orderApartments
apt.
Price per m²
3 853 
3 456 
2 982 
2 732 
2 583 
2 511 
2 361 
2 286 
2 276 

Least expensive cities

City
name
Ascending orderHouses
house
Price per m²
381 
417 
462 
466 
539 
544 
628 
City
name
Ascending orderApartments
apt.
Price per m²
73 
195 
195 
200 
222 
237 
240