Median price of real estate
in the municipality of Villards-d'Héria
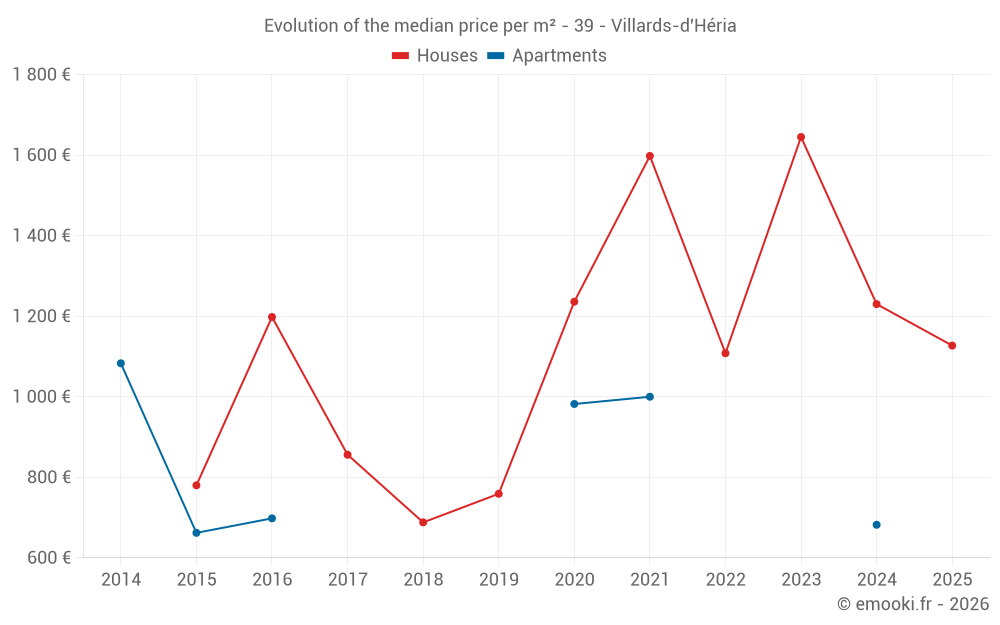
Houses
1 233 € /m²
Reliability 5/10
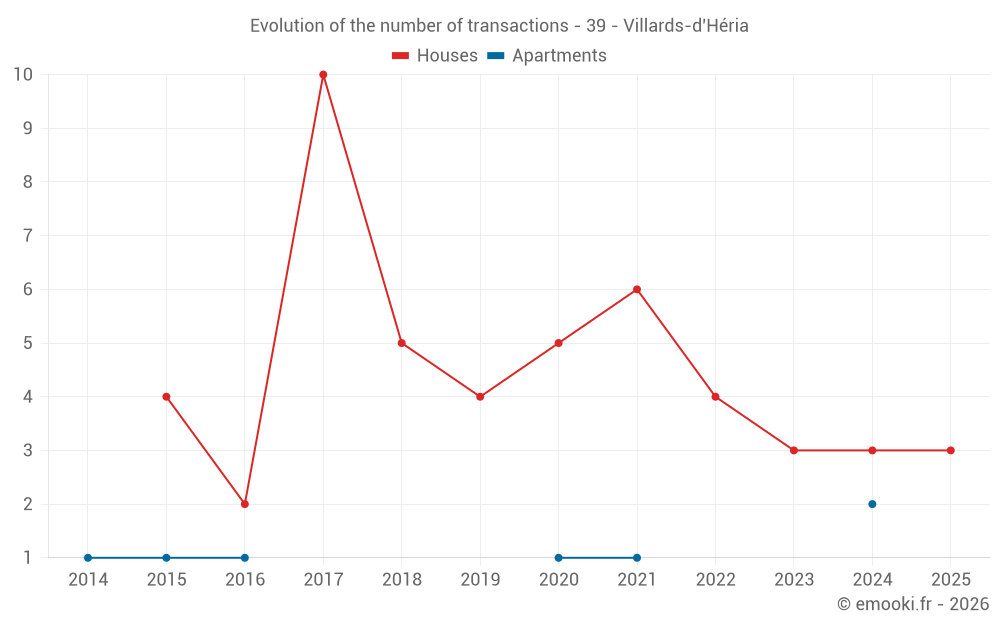
Median price on the 14 transactions of the last 48 months.
from 860 to
1 695 € /m²
1 695 € /m²
60% of transactions from the 2nd to the 8th deciles.
Apartments
991 € /m²
Reliability 2/10
Median price on the 4 transactions of the last 96 months.
Dwellings
1 136 € /m²
Reliability 6/10
Median price on the 13 transactions of the last 36 months.
from 743 to
1 664 € /m²
1 664 € /m²
60% of transactions from the 2nd to the 8th deciles.