emooki
HomePrice mapTransactions
🇬🇧 English🇫🇷 Français🇩🇪 Deutsch🇪🇸 Español🇮🇹 Italiano

Real estate price map


Real estate price map in the municipality of Mont-sous-Vaudrey, choose a section to see transactions by parcel.

Jura (39)

Mont-sous-Vaudrey - Real estate price m²

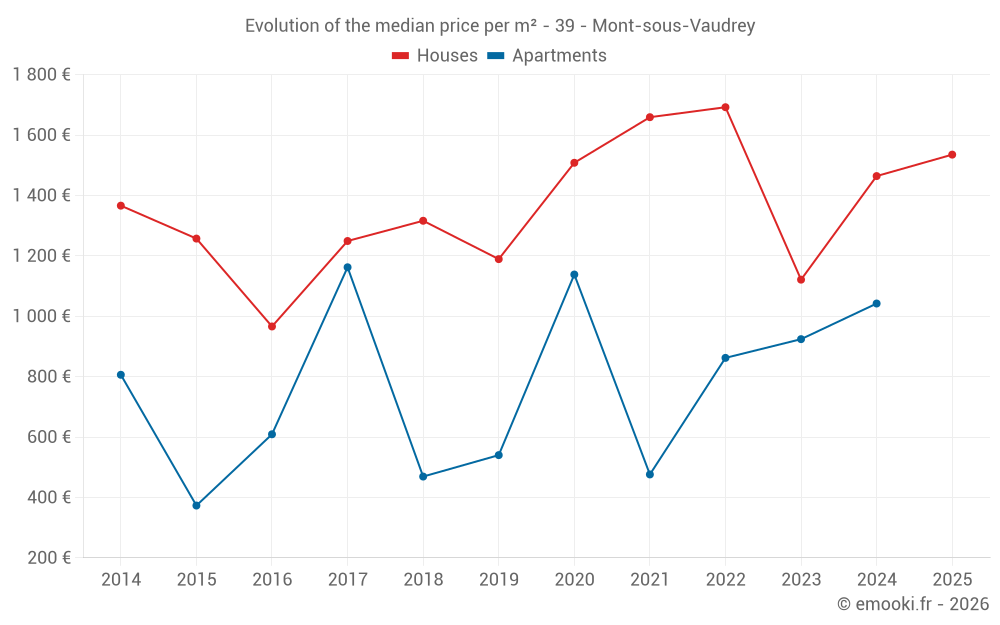
Median price of real estate
in the municipality of Mont-sous-Vaudrey

HousesHouses
1 535  /m²
1-23-45-67-89-10
Reliability 7/10
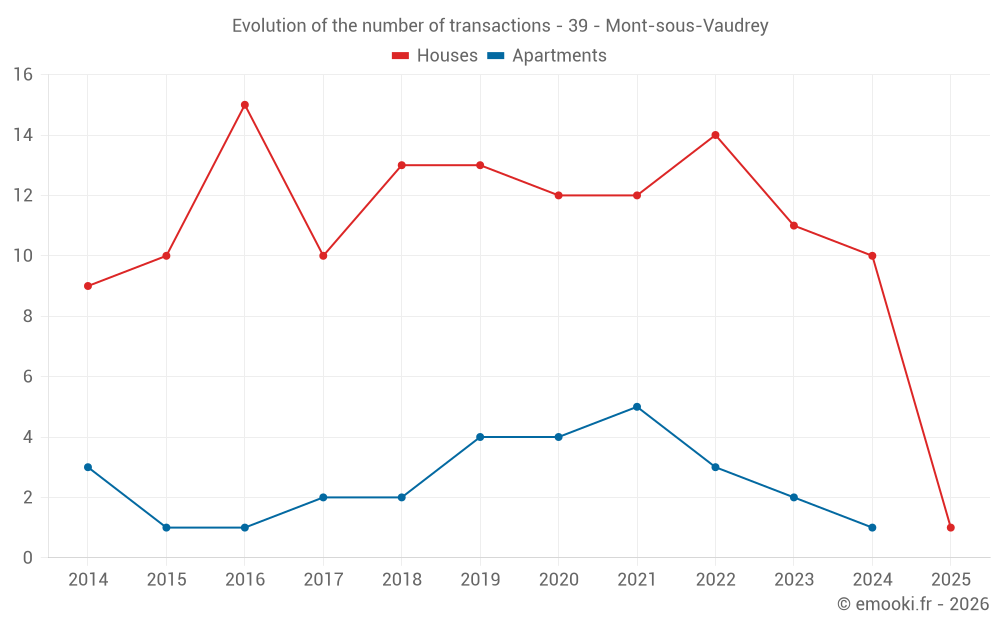
Median price on the 17 transactions of the last 24 months.
from 1 175 to
1 983  /m²
60% of transactions from the 2nd to the 8th deciles.
ApartmentsApartments
761  /m²
1-23-45-67-89-10
Reliability 4/10
Median price on the 13 transactions of the last 60 months.
from 476 to
1 146  /m²
60% of transactions from the 2nd to the 8th deciles.
DwellingsDwellings
1 518  /m²
1-23-45-67-89-10
Reliability 7/10
Median price on the 20 transactions of the last 24 months.
from 1 105 to
1 932  /m²
60% of transactions from the 2nd to the 8th deciles.

Yearly evolution

Evolution of the median price per m²

Evolution of the median price per m² - 39 - Mont-sous-Vaudrey

Evolution of the number of transactions

Warning, last year incomplete. Projections made based on the proportions between semesters of the previous year at the departmental/national level and by type of property.

Evolution of the number of transactions - 39 - Mont-sous-Vaudrey

Yearly data

Descending order
Year
Houses
house
transactions
Houses
house
Price per m²
Apartments
apt.
transactions
Apartments
apt.
Price per m²
2025
1
1 535 
0
--- 
2024
10
1 464 
1
1 042 
2023
11
1 121 
2
924 
2022
14
1 692 
3
862 
2021
12
1 659 
5
476 
2020
12
1 508 
4
1 138 
2019
13
1 189 
4
540 
2018
13
1 316 
2
469 
2017
10
1 249 
2
1 162 
2016
15
966 
1
609 
2015
10
1 257 
1
373 
2014
9
1 366 
3
806 

Analysis

Structure of prices per m²

Values of price percentiles per m² over the periods used for the estimated price of each type of property.

Structure of transaction amounts

Values of transaction amounts percentiles over the periods used for the estimated price of each type of property.

Transaction amounts and prices per m² by percentile

Ascending order
Percentile
Houses
house
Price per m²
Houses
house
Transaction amount
Apartments
apt.
Price per m²
Apartments
apt.
Transaction amount
10th percentile
939 
74 000 
240 
34 600 
20th percentile
1 175 
124 K
476 
128 K
30th percentile
1 274 
140 K
499 
153 K
40th percentile
1 418 
146 K
617 
165 K
50th percentile
1 535 
155 K
761 
188 K
60th percentile
1 713 
168 K
883 
198 K
70th percentile
1 837 
187 K
998 
200 K
80th percentile
1 983 
222 K
1 146 
260 K
90th percentile
2 369 
260 K
1 234 
356 K

National and departmental comparison

Evolution of the median price per m² of houses

Evolution of the median price per m² of apartments

Quarterly evolution

Evolution of the median price per m²

Evolution of the number of transactions

Quarterly data

Descending order
Quarter
Houses
house
transactions
Houses
house
Price per m²
Apartments
apt.
transactions
Apartments
apt.
Price per m²
2025 Q1
1
1 535 
0
--- 
2024 Q4
2
1 994 
0
--- 
2024 Q3
3
1 915 
1
1 042 
2024 Q2
3
1 160 
0
--- 
2024 Q1
2
1 398 
0
--- 
2023 Q4
2
1 890 
1
179 
2023 Q3
4
1 659 
1
1 670 
2023 Q2
3
656 
0
--- 
2023 Q1
2
1 059 
0
--- 
2022 Q4
4
1 560 
1
1 239 
2022 Q3
3
2 165 
0
--- 
2022 Q2
5
1 446 
0
--- 
2022 Q1
2
1 666 
2
812 
2021 Q4
5
1 735 
0
--- 
2021 Q3
2
1 722 
1
969 
2021 Q2
2
1 594 
1
515 
2021 Q1
3
1 626 
3
476 
2020 Q4
4
1 788 
1
643 
2020 Q3
5
1 356 
1
1 215 
2020 Q2
2
1 505 
1
1 151 
2020 Q1
1
1 500 
1
1 126 
2019 Q4
5
1 148 
0
--- 
2019 Q3
4
1 610 
1
840 
2019 Q2
3
900 
2
540 
2019 Q1
1
1 189 
1
147 
2018 Q4
6
1 284 
0
--- 
2018 Q3
4
1 570 
0
--- 
2018 Q2
2
1 446 
1
476 
2018 Q1
1
417 
1
462 
2017 Q4
0
--- 
2
1 162 
2017 Q3
2
1 328 
0
--- 
2017 Q2
5
1 188 
0
--- 
2017 Q1
3
1 310 
0
--- 
2016 Q4
6
1 066 
1
609 
2016 Q3
5
800 
0
--- 
2016 Q2
3
1 301 
0
--- 
2016 Q1
1
586 
0
--- 
2015 Q4
2
719 
1
373 
2015 Q3
4
1 462 
0
--- 
2015 Q2
1
600 
0
--- 
2015 Q1
3
1 512 
0
--- 
2014 Q4
2
1 276 
2
634 
2014 Q3
1
1 333 
0
--- 
2014 Q2
3
1 593 
1
1 000 
2014 Q1
3
1 508 
0
--- 

Overview of the latest real estate transactions

The following list is an anonymized overview of the latest transactions. For more details and to find all transactions, please use the map to view transactions by plot or the transaction search page for a search by criteria.

2025-03-29
15 000 
Sale
Land
810 m2
-Taillis simples
2025-02-14
1 800 
Sale
Land
3880 m2
-Jardins
2025-02-04
100 
Sale
Land
822 m2
-Prés
Land
254 m2
-Prés
2025-01-24
155 000 
1 535  /m²(101 m²)
Sale
Houses
House
4 rooms
101 m2
2 outbuildings
Land
485 m2
-Sols
Land
5 m2
-Prés
Land
45 m2
-Sols
Land
465 m2
-Prés
Land
260 m2
-Jardins
2024-12-20
492 
Sale
Land
1640 m2
-Terres
2024-11-15
224 170 
2 176  /m²(103 m²)
Sale
Houses
House
4 rooms
103 m2
1 outbuilding
Land
1217 m2
-Landes
2024-10-24
145 000 
1 813  /m²(80 m²)
Sale
Houses
House
3 rooms
80 m2
Land
196 m2
-Jardins
Land
282 m2
-Sols
Land
672 m2
-Jardins
2024-09-27
150 000 
1 042  /m²(144 m²)
Sale
Apartments
Apartment
3 rooms
72 m2
Apartments
Apartment
3 rooms
72 m2
4 outbuildings
Land
322 m2
-Sols
Land
139 m2
-Sols
Land
87 m2
-Jardins
Land
443 m2
-Jardins
Land
79 m2
-Jardins
Land
52 m2
-Sols
Land
99 m2
-Jardins
2024-09-23
148 000 
2 000  /m²(74 m²)
Sale
Houses
House
3 rooms
74 m2
Land
399 m2
-Sols
Land
901 m2
-Vergers
2024-09-20
40 000 
Sale
Land
1558 m2
-Prés
2024-09-12
268 100 
1 915  /m²(140 m²)
Sale
Houses
House
4 rooms
140 m2
Land
1000 m2
-Sols
Land
1000 m2
-Prés
Land
564 m2
-Prés
2024-07-30
40 000 
Sale
Land
427 m2
-Prés
Land
679 m2
-Prés
Land
44 m2
-Prés
2024-07-24
300 000 
1 364  /m²(220 m²)
Sale
Houses
House
4 rooms
220 m2
4 outbuildings
Land
733 m2
-Sols
Land
679 m2
-Sols
Land
241 m2
-Sols
Land
10 m2
-Sols
Land
489 m2
-Prés
Land
428 m2
-Prés
2024-07-24
680 000 
587  /m²(1159 m²)
Sale
Commercial property
1159 m2
Land
1061 m2
-Sols
Land
241 m2
-Sols
Land
1800 m2
-Prés
2024-06-13
250 000 
360  /m²(695 m²)
Sale
Commercial property
105 m2
Commercial property
245 m2
Commercial property
345 m2
Land
4439 m2
-Prés
Land
3236 m2
-Sols
2024-05-17
140 000 
1 284  /m²(109 m²)
Sale
Houses
House
4 rooms
109 m2
Land
1250 m2
-Sols
2024-04-29
138 000 
1 160  /m²(119 m²)
Sale
Houses
House
4 rooms
119 m2
Land
804 m2
-Sols
2024-04-24
50 000 
667  /m²(75 m²)
Sale
Houses
House
2 rooms
75 m2
Land
191 m2
-Sols
Land
906 m2
-Sols
2024-03-19
158 000 
1 564  /m²(101 m²)
Sale
Houses
House
5 rooms
101 m2
Land
848 m2
-Sols
2024-03-08
3 500 
Sale
Land
2240 m2
-Terres
311 transactions listed in the municipality

Jura (39)

Most expensive cities

City
name
Descending orderHouses
house
Price per m²
4 238 
3 961 
3 877 
3 513 
3 178 
3 007 
2 996 
2 918 
2 846 
City
name
Descending orderApartments
apt.
Price per m²
3 853 
3 456 
2 982 
2 732 
2 583 
2 511 
2 361 
2 286 
2 276 

Least expensive cities

City
name
Ascending orderHouses
house
Price per m²
381 
417 
462 
466 
539 
544 
628 
City
name
Ascending orderApartments
apt.
Price per m²
73 
195 
195 
200 
222 
237 
240