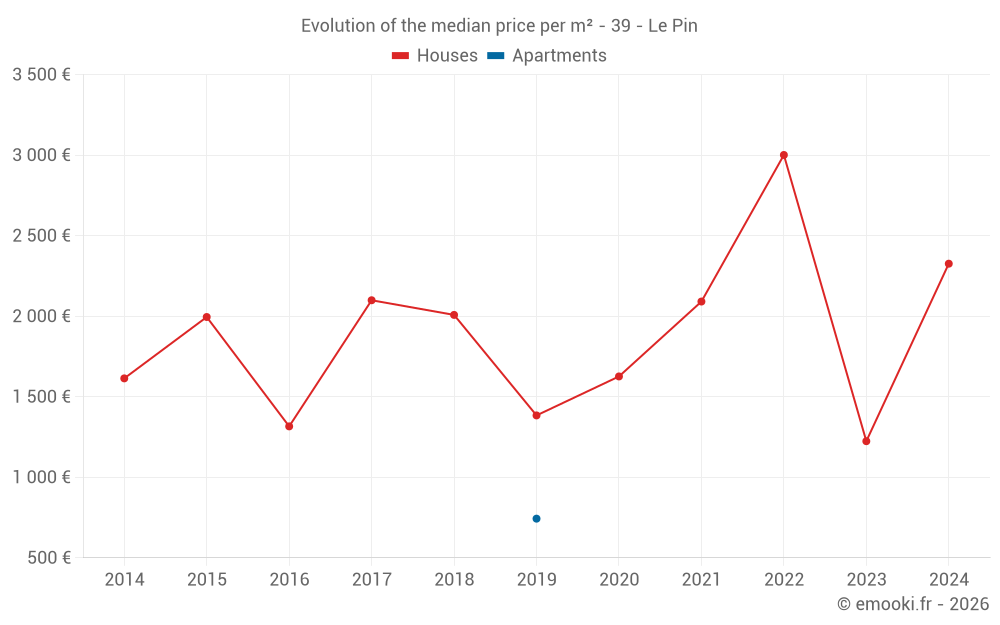
Median price of real estate
in the municipality of Le Pin
Houses
2 370 € /m²
Reliability 5/10
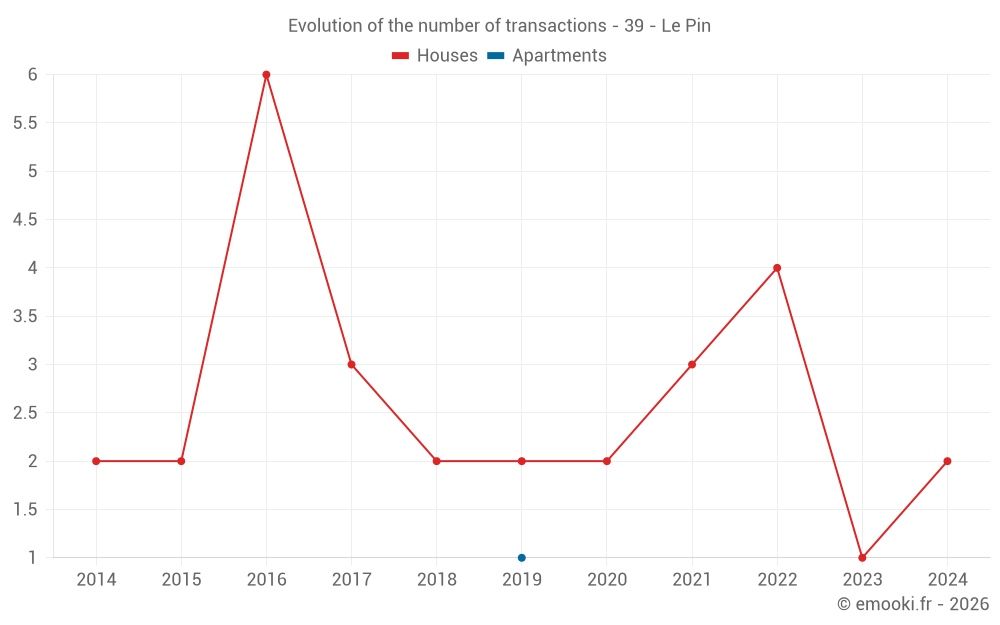
Median price on the 10 transactions of the last 48 months.
Apartments
743 € /m²
Reliability 1/10
Price of the unique transaction of the last 120 months.
Dwellings
2 370 € /m²
Reliability 5/10
Median price on the 10 transactions of the last 48 months.