emooki
HomePrice mapTransactions
🇬🇧 English🇫🇷 Français🇩🇪 Deutsch🇪🇸 Español🇮🇹 Italiano

Real estate price map


Real estate price map in the municipality of Saint-Laurent-en-Grandvaux, choose a section to see transactions by parcel.

Jura (39)

Saint-Laurent-en-Grandvaux - Real estate price m²

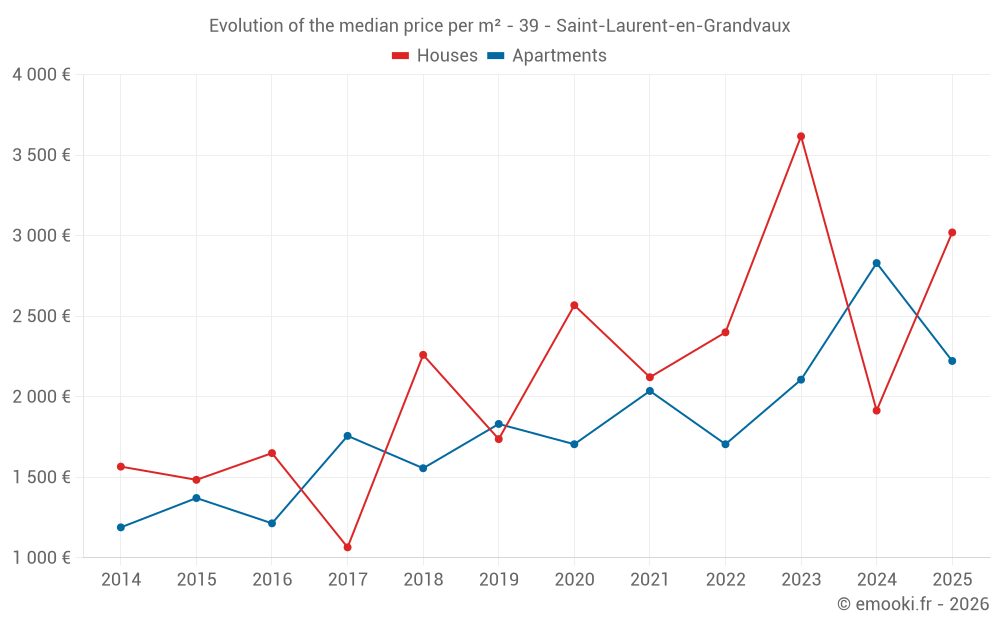
Median price of real estate
in the municipality of Saint-Laurent-en-Grandvaux

HousesHouses
3 351  /m²
1-23-45-67-89-10
Reliability 7/10
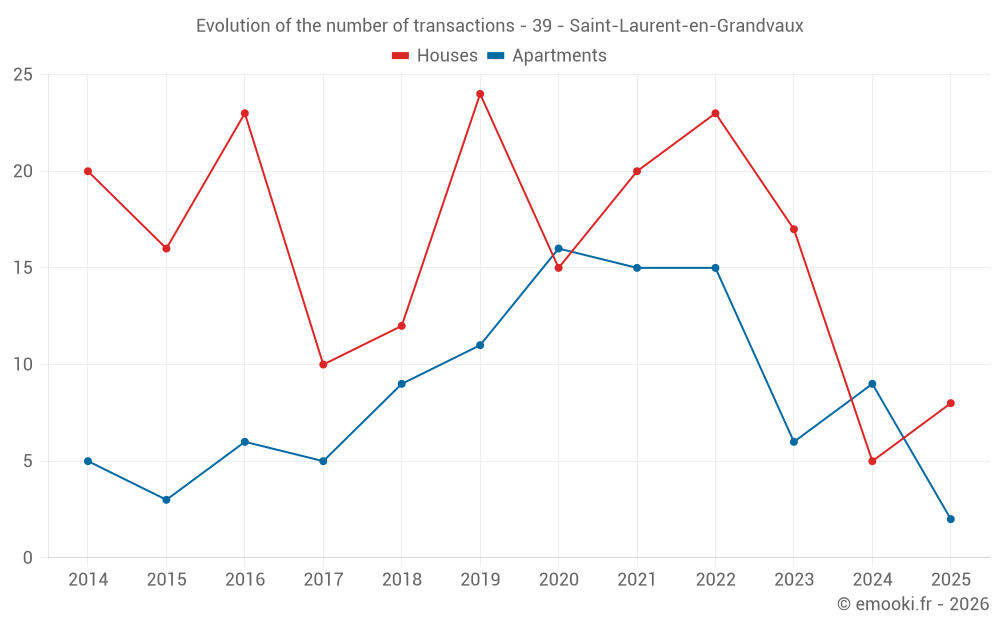
Median price on the 24 transactions of the last 24 months.
from 1 930 to
4 424  /m²
60% of transactions from the 2nd to the 8th deciles.
ApartmentsApartments
2 405  /m²
1-23-45-67-89-10
Reliability 6/10
Median price on the 25 transactions of the last 36 months.
from 1 620 to
2 876  /m²
60% of transactions from the 2nd to the 8th deciles.
DwellingsDwellings
2 405  /m²
1-23-45-67-89-10
Reliability 8/10
Median price on the 19 transactions of the last 12 months.
from 1 922 to
3 426  /m²
60% of transactions from the 2nd to the 8th deciles.
HousesEvolution of the price per m² of houses since...
1 year
+58%
2 years
-17%
3 years
+26%
4 years
+42%
5 years
+18%
6 years
+74%
7 years
+34%
8 years
+184%
9 years
+83%
10 years
+104%
11 years
+93%
The price per m² of houses has decreased by 17% since 2 years, but it has increased by 184% in 8 years.

Yearly evolution

Evolution of the median price per m²

Evolution of the median price per m² - 39 - Saint-Laurent-en-Grandvaux

Evolution of the number of transactions

Warning, last year incomplete. Projections made based on the proportions between semesters of the previous year at the departmental/national level and by type of property.

Evolution of the number of transactions - 39 - Saint-Laurent-en-Grandvaux

Yearly data

Descending order
Year
Houses
house
transactions
Houses
house
Price per m²
Apartments
apt.
transactions
Apartments
apt.
Price per m²
2025
8
3 020 
2
2 222 
2024
5
1 914 
9
2 830 
2023
17
3 617 
6
2 106 
2022
23
2 400 
15
1 705 
2021
20
2 121 
15
2 036 
2020
15
2 568 
16
1 705 
2019
24
1 737 
11
1 831 
2018
12
2 260 
9
1 556 
2017
10
1 065 
5
1 757 
2016
23
1 650 
6
1 214 
2015
16
1 484 
3
1 371 
2014
20
1 566 
5
1 189 

Analysis

Structure of prices per m²

Values of price percentiles per m² over the periods used for the estimated price of each type of property.

Structure of transaction amounts

Values of transaction amounts percentiles over the periods used for the estimated price of each type of property.

Transaction amounts and prices per m² by percentile

Ascending order
Percentile
Houses
house
Price per m²
Houses
house
Transaction amount
Apartments
apt.
Price per m²
Apartments
apt.
Transaction amount
10th percentile
1 845 
173 K
1 133 
76 656 
20th percentile
1 930 
187 K
1 620 
90 552 
30th percentile
2 353 
214 K
1 932 
103 K
40th percentile
2 813 
226 K
2 232 
117 K
50th percentile
3 351 
236 K
2 405 
123 K
60th percentile
3 599 
261 K
2 640 
139 K
70th percentile
3 814 
272 K
2 796 
198 K
80th percentile
4 424 
300 K
2 876 
214 K
90th percentile
5 180 
333 K
3 068 
268 K

National and departmental comparison

Evolution of the median price per m² of houses

Evolution of the median price per m² of apartments

Quarterly evolution

Evolution of the median price per m²

Evolution of the number of transactions

Quarterly data

Descending order
Quarter
Houses
house
transactions
Houses
house
Price per m²
Apartments
apt.
transactions
Apartments
apt.
Price per m²
2025 Q2
2
4 443 
1
2 177 
2025 Q1
6
2 540 
1
2 268 
2024 Q4
1
3 844 
6
2 564 
2024 Q3
2
1 792 
0
--- 
2024 Q2
0
--- 
3
2 843 
2024 Q1
2
2 036 
0
--- 
2023 Q4
5
3 344 
0
--- 
2023 Q3
6
3 736 
2
2 178 
2023 Q2
3
3 125 
1
2 584 
2023 Q1
3
4 938 
3
1 629 
2022 Q4
7
2 727 
4
2 180 
2022 Q3
7
2 143 
4
2 119 
2022 Q2
7
2 764 
7
1 306 
2022 Q1
2
2 082 
0
--- 
2021 Q4
4
1 944 
6
1 998 
2021 Q3
7
1 732 
1
991 
2021 Q2
3
2 217 
1
2 006 
2021 Q1
6
2 394 
7
2 130 
2020 Q4
3
2 843 
5
2 110 
2020 Q3
5
2 525 
4
1 746 
2020 Q2
4
2 812 
6
1 461 
2020 Q1
3
2 109 
1
1 684 
2019 Q4
6
1 622 
3
1 831 
2019 Q3
6
1 831 
1
1 895 
2019 Q2
9
1 976 
3
1 889 
2019 Q1
3
917 
4
1 578 
2018 Q4
4
2 116 
1
1 556 
2018 Q3
5
2 353 
2
1 543 
2018 Q2
2
2 698 
4
1 080 
2018 Q1
1
938 
2
1 957 
2017 Q4
2
356 
1
529 
2017 Q3
4
1 056 
1
2 193 
2017 Q2
1
649 
0
--- 
2017 Q1
3
2 127 
3
1 757 
2016 Q4
8
1 617 
1
1 274 
2016 Q3
7
2 426 
2
1 380 
2016 Q2
3
2 221 
2
1 361 
2016 Q1
5
1 481 
1
1 154 
2015 Q4
2
1 726 
0
--- 
2015 Q3
5
1 597 
1
2 271 
2015 Q2
5
548 
0
--- 
2015 Q1
4
114 
2
836 
2014 Q4
2
2 048 
0
--- 
2014 Q3
6
1 744 
2
1 048 
2014 Q2
10
697 
2
1 640 
2014 Q1
2
1 636 
1
897 

Overview of the latest real estate transactions

The following list is an anonymized overview of the latest transactions. For more details and to find all transactions, please use the map to view transactions by plot or the transaction search page for a search by criteria.

2025-04-29
262 500 
5 357  /m²(49 m²)
Sale
Houses
House
2 rooms
49 m2
2025-04-25
135 000 
2 177  /m²(62 m²)
Sale
Apartments
Apartment
3 rooms
62 m2
1 outbuilding
2025-04-18
318 000 
Sale
Land
81462 m2
-Prés
Land
10590 m2
-Taillis simples
2025-04-01
300 000 
3 529  /m²(85 m²)
Sale
Houses
House
2 rooms
85 m2
2 outbuildings
Land
1000 m2
-Sols
Land
1564 m2
-Terrains d'agrément
2025-03-11
4 000 
Sale
Land
19530 m2
-Prés
Land
380 m2
-Landes
Land
2100 m2
-Pâtures
2025-03-03
546 700 
6 508  /m²(84 m²)
Sale
Houses
House
6 rooms
84 m2
Land
895 m2
-Sols
2025-02-21
235 000 
2 398  /m²(98 m²)
Sale
Houses
House
4 rooms
98 m2
2 outbuildings
Land
596 m2
-Sols
2025-02-12
165 000 
1 941  /m²(85 m²)
Sale
Houses
House
5 rooms
85 m2
Land
750 m2
-Sols
2025-02-07
15 200 
Sale
Land
6460 m2
-Futaies résineuses
Land
2018 m2
-Futaies résineuses
2025-01-28
225 000 
3 358  /m²(67 m²)
Sale
Houses
House
3 rooms
67 m2
Land
735 m2
-Sols
2025-01-16
215 000 
1 822  /m²(118 m²)
Sale
Houses
House
7 rooms
118 m2
2 outbuildings
Land
1132 m2
-Sols
2025-01-15
900 
Sale
Land
4337 m2
-Pâtures
Land
3250 m2
-Pâtures
Land
1560 m2
-Futaies résineuses
2025-01-09
280 000 
354  /m²(791 m²)
Sale
Commercial property
440 m2
Land
2058 m2
-Sols
Commercial property
168 m2
Commercial property
183 m2
Land
670 m2
-Sols
Land
141 m2
-Sols
Land
1530 m2
-Sols
Land
30 m2
-Sols
Land
11 m2
-Sols
Land
7 m2
-Sols
2025-01-09
47 000 
Sale
Land
2090 m2
-Futaies résineuses
Land
31110 m2
-Futaies résineuses
Land
34510 m2
-Futaies résineuses
/EPICE
Land
2710 m2
-Taillis sous futaie
Land
1430 m2
-Taillis sous futaie
2025-01-07
220 000 
2 683  /m²(82 m²)
Sale
Houses
House
4 rooms
82 m2
Land
727 m2
-Sols
2025-01-07
5 000 
Sale
Land
1528 m2
-Prés
2025-01-04
199 600 
2 268  /m²(88 m²)
Sale
Apartments
Apartment
4 rooms
88 m2
2 outbuildings
2024-12-27
230 644 
3 844  /m²(60 m²)
Sale
Houses
House
2 rooms
60 m2
Land
516 m2
-Sols
2024-12-17
14 929 
Sale
Land
22090 m2
-Futaies résineuses
2024-12-17
2 400 
Sale
Land
7261 m2
-Pâtures
510 transactions listed in the municipality

Jura (39)

Most expensive cities

City
name
Descending orderHouses
house
Price per m²
4 238 
3 961 
3 877 
3 513 
3 178 
3 007 
2 996 
2 918 
2 846 
City
name
Descending orderApartments
apt.
Price per m²
3 853 
3 456 
2 982 
2 732 
2 583 
2 511 
2 361 
2 286 
2 276 

Least expensive cities

City
name
Ascending orderHouses
house
Price per m²
381 
417 
462 
466 
539 
544 
628 
City
name
Ascending orderApartments
apt.
Price per m²
73 
195 
195 
200 
222 
237 
240