emooki
HomePrice mapTransactions
🇬🇧 English🇫🇷 Français🇩🇪 Deutsch🇪🇸 Español🇮🇹 Italiano

Real estate price map


Real estate price map in the Pyrénées-Atlantiques department.

Department 64
Pyrénées-Atlantiques

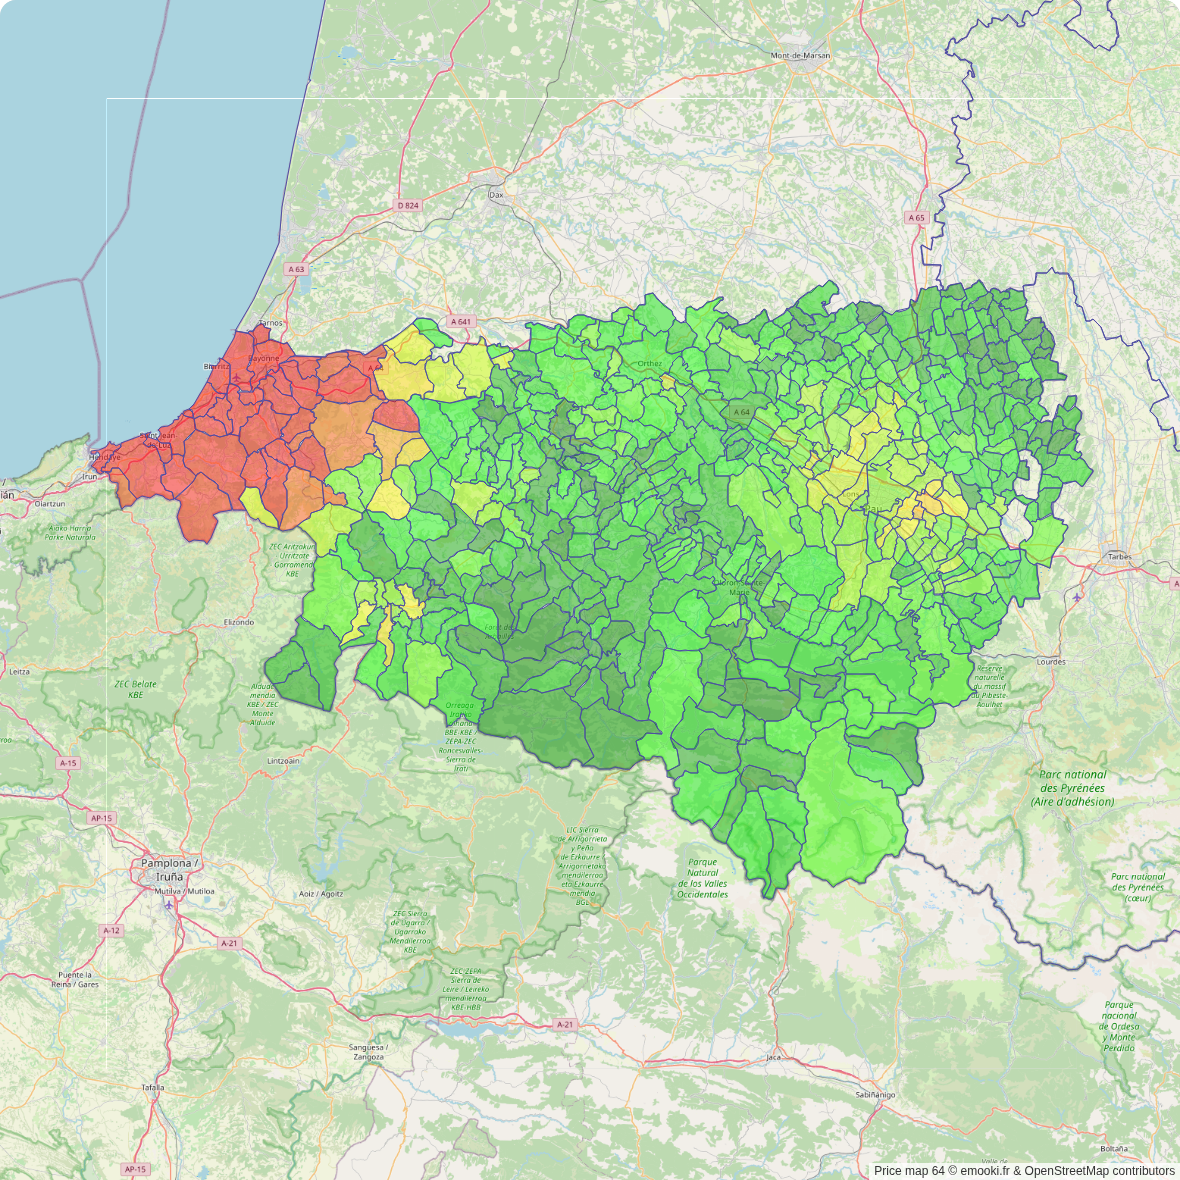
Median price of real estate
in the Pyrénées-Atlantiques department

HousesHouses
2 583  /m²
1-23-45-67-89-10
Reliability 10/10
Median price on the 679 transactions of the last 3 months.
from 1 617 to
4 849  /m²
60% of transactions from the 2nd to the 8th deciles.
ApartmentsApartments
3 724  /m²
1-23-45-67-89-10
Reliability 10/10
Median price on the 1028 transactions of the last 3 months.
from 2 038 to
5 916  /m²
60% of transactions from the 2nd to the 8th deciles.
DwellingsDwellings
3 086  /m²
1-23-45-67-89-10
Reliability 10/10
Median price on the 1707 transactions of the last 3 months.
from 1 856 to
5 602  /m²
60% of transactions from the 2nd to the 8th deciles.
HousesEvolution of the price per m² of houses since...
1 year
+5.4%
2 years
+3.3%
3 years
+4.9%
4 years
+14%
5 years
+22%
6 years
+26%
7 years
+27%
8 years
+26%
9 years
+30%
10 years
+35%
11 years
+32%
ApartmentsEvolution of the price per m² of apartments since...
1 year
+4.5%
2 years
+12%
3 years
+7.2%
4 years
+14%
5 years
+25%
6 years
+26%
7 years
+33%
8 years
+35%
9 years
+43%
10 years
+53%
11 years
+48%

Yearly evolution

Evolution of the median price per m²

Evolution of the number of transactions

Warning, last year incomplete. Projections made based on the proportions between semesters of the previous year at the departmental/national level and by type of property.

Yearly data

Descending order
Year
Houses
house
transactions
Houses
house
Price per m²
Apartments
apt.
transactions
Apartments
apt.
Price per m²
2025
1 617
2 500 
2 309
3 396 
2024
3 859
2 372 
5 275
3 251 
2023
4 112
2 421 
5 618
3 045 
2022
5 052
2 383 
7 028
3 168 
2021
5 742
2 192 
7 877
2 982 
2020
5 007
2 044 
6 660
2 718 
2019
4 987
1 986 
7 002
2 687 
2018
4 458
1 970 
6 357
2 562 
2017
4 400
1 978 
6 545
2 519 
2016
3 856
1 917 
5 656
2 381 
2015
3 576
1 857 
5 046
2 224 
2014
3 026
1 894 
4 031
2 295 

Analysis

Structure of prices per m²

Values of price percentiles per m² over the periods used for the estimated price of each type of property.

Structure of transaction amounts

Values of transaction amounts percentiles over the periods used for the estimated price of each type of property.

Transaction amounts and prices per m² by percentile

Ascending order
Percentile
Houses
house
Price per m²
Houses
house
Transaction amount
Apartments
apt.
Price per m²
Apartments
apt.
Transaction amount
10th percentile
1 171 
126 K
1 602 
74 400 
20th percentile
1 617 
180 K
2 038 
103 K
30th percentile
1 941 
215 K
2 436 
127 K
40th percentile
2 305 
250 K
2 981 
160 K
50th percentile
2 583 
295 K
3 724 
201 K
60th percentile
3 016 
352 K
4 330 
235 K
70th percentile
3 596 
425 K
5 024 
285 K
80th percentile
4 849 
529 K
5 916 
359 K
90th percentile
6 827 
800 K
7 469 
480 K

Quarterly evolution

Evolution of the median price per m²

Evolution of the number of transactions

Quarterly data

Descending order
Quarter
Houses
house
transactions
Houses
house
Price per m²
Apartments
apt.
transactions
Apartments
apt.
Price per m²
2025 Q2
679
2 583 
1 028
3 724 
2025 Q1
938
2 398 
1 281
3 086 
2024 Q4
1 082
2 344 
1 415
3 350 
2024 Q3
1 109
2 400 
1 465
3 249 
2024 Q2
893
2 367 
1 283
3 143 
2024 Q1
775
2 394 
1 112
3 232 
2023 Q4
947
2 400 
1 264
2 970 
2023 Q3
1 123
2 431 
1 433
3 068 
2023 Q2
1 079
2 394 
1 489
3 177 
2023 Q1
963
2 448 
1 432
2 994 
2022 Q4
1 164
2 484 
1 612
3 076 
2022 Q3
1 431
2 435 
1 870
2 910 
2022 Q2
1 305
2 339 
1 873
3 333 
2022 Q1
1 152
2 273 
1 673
3 261 
2021 Q4
1 407
2 253 
1 878
3 016 
2021 Q3
1 753
2 216 
2 166
2 998 
2021 Q2
1 415
2 169 
2 189
3 021 
2021 Q1
1 167
2 110 
1 644
2 892 
2020 Q4
1 664
2 039 
2 000
2 895 
2020 Q3
1 261
2 043 
1 655
2 604 
2020 Q2
1 025
2 086 
1 493
2 698 
2020 Q1
1 057
2 012 
1 512
2 684 
2019 Q4
1 332
2 000 
1 788
2 736 
2019 Q3
1 409
1 944 
1 847
2 631 
2019 Q2
1 174
1 976 
1 784
2 742 
2019 Q1
1 072
2 013 
1 583
2 639 
2018 Q4
1 225
1 958 
1 591
2 569 
2018 Q3
1 214
1 978 
1 670
2 484 
2018 Q2
1 092
1 934 
1 646
2 590 
2018 Q1
927
2 005 
1 450
2 552 
2017 Q4
1 109
2 000 
1 549
2 595 
2017 Q3
1 178
1 994 
1 635
2 524 
2017 Q2
1 110
1 990 
1 726
2 528 
2017 Q1
1 003
1 927 
1 635
2 466 
2016 Q4
1 069
1 940 
1 631
2 433 
2016 Q3
1 096
1 902 
1 511
2 383 
2016 Q2
949
1 915 
1 356
2 370 
2016 Q1
742
1 907 
1 158
2 291 
2015 Q4
1 004
1 893 
1 377
2 272 
2015 Q3
1 070
1 859 
1 376
2 236 
2015 Q2
808
1 824 
1 285
2 131 
2015 Q1
694
1 854 
1 008
2 268 
2014 Q4
783
1 917 
972
2 299 
2014 Q3
864
1 862 
1 064
2 291 
2014 Q2
682
1 884 
953
2 230 
2014 Q1
697
1 913 
1 042
2 332 

Pyrénées-Atlantiques (64)

Most expensive cities

City
name
Descending orderHouses
house
Price per m²
10 052 
7 465 
7 381 
6 416 
6 300 
6 095 
5 504 
5 458 
5 396 
City
name
Descending orderApartments
apt.
Price per m²
8 335 
7 541 
5 454 
5 412 
5 241 
4 973 
4 853 
4 674 
4 591 

Least expensive cities

City
name
Ascending orderHouses
house
Price per m²
512 
535 
656 
753 
764 
792 
824 
City
name
Ascending orderApartments
apt.
Price per m²
216 
228 
240 
333 
355