emooki
HomePrice mapTransactions
🇬🇧 English🇫🇷 Français🇩🇪 Deutsch🇪🇸 Español🇮🇹 Italiano

Real estate price map


Real estate price map in the municipality of Billère.

Pyrénées-Atlantiques (64)
Billère

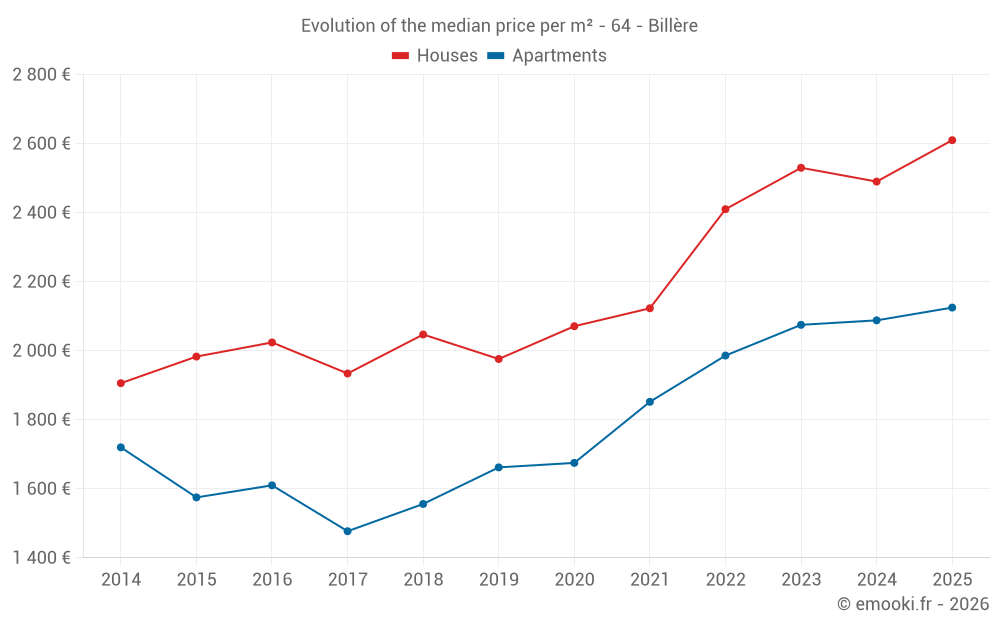
Median price of real estate
in the municipality of Billère

HousesHouses
2 492  /m²
1-23-45-67-89-10
Reliability 8/10
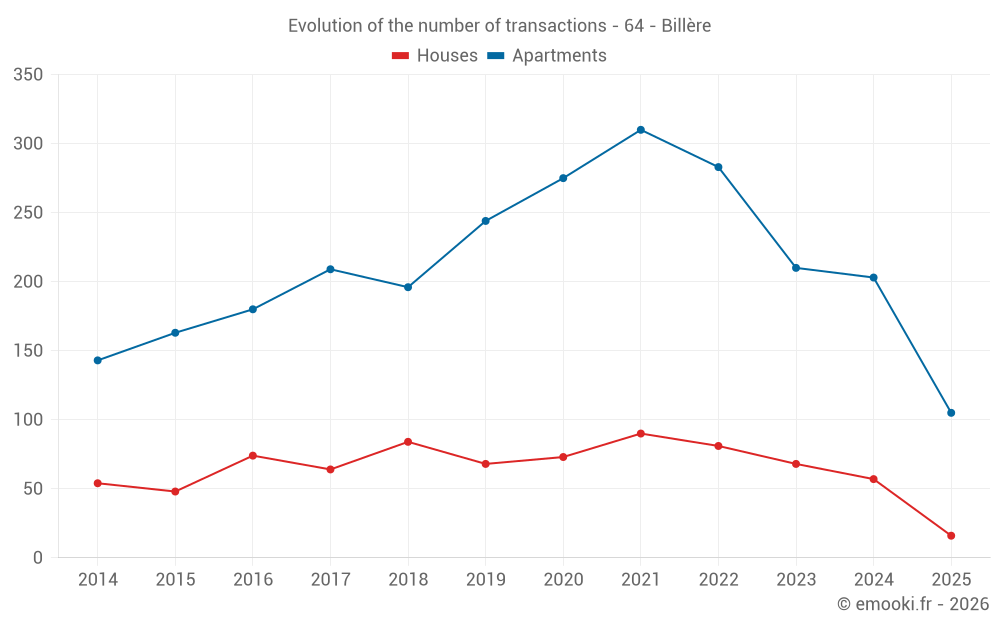
Median price on the 50 transactions of the last 12 months.
from 1 718 to
2 930  /m²
60% of transactions from the 2nd to the 8th deciles.
ApartmentsApartments
2 125  /m²
1-23-45-67-89-10
Reliability 10/10
Median price on the 37 transactions of the last 3 months.
from 1 756 to
2 449  /m²
60% of transactions from the 2nd to the 8th deciles.
DwellingsDwellings
2 184  /m²
1-23-45-67-89-10
Reliability 10/10
Median price on the 46 transactions of the last 3 months.
from 1 765 to
2 534  /m²
60% of transactions from the 2nd to the 8th deciles.
HousesEvolution of the price per m² of houses since...
1 year
+4.8%
2 years
+3.2%
3 years
+8.3%
4 years
+23%
5 years
+26%
6 years
+32%
7 years
+28%
8 years
+35%
9 years
+29%
10 years
+32%
11 years
+37%
ApartmentsEvolution of the price per m² of apartments since...
1 year
+1.8%
2 years
+2.4%
3 years
+7%
4 years
+15%
5 years
+27%
6 years
+28%
7 years
+37%
8 years
+44%
9 years
+32%
10 years
+35%
11 years
+24%

Yearly evolution

Evolution of the median price per m²

Evolution of the number of transactions

Warning, last year incomplete. Projections made based on the proportions between semesters of the previous year at the departmental/national level and by type of property.

Yearly data

Descending order
Year
Houses
house
transactions
Houses
house
Price per m²
Apartments
apt.
transactions
Apartments
apt.
Price per m²
2025
16
2 610 
105
2 125 
2024
57
2 490 
203
2 088 
2023
68
2 530 
210
2 075 
2022
81
2 410 
283
1 986 
2021
90
2 123 
310
1 852 
2020
73
2 071 
275
1 675 
2019
68
1 976 
244
1 662 
2018
84
2 047 
196
1 556 
2017
64
1 934 
209
1 477 
2016
74
2 024 
180
1 610 
2015
48
1 983 
163
1 575 
2014
54
1 906 
143
1 720 

Analysis

Structure of prices per m²

Values of price percentiles per m² over the periods used for the estimated price of each type of property.

Structure of transaction amounts

Values of transaction amounts percentiles over the periods used for the estimated price of each type of property.

Transaction amounts and prices per m² by percentile

Ascending order
Percentile
Houses
house
Price per m²
Houses
house
Transaction amount
Apartments
apt.
Price per m²
Apartments
apt.
Transaction amount
10th percentile
1 546 
168 K
1 477 
74 800 
20th percentile
1 718 
189 K
1 756 
85 760 
30th percentile
2 079 
209 K
1 891 
94 504 
40th percentile
2 371 
230 K
2 062 
126 K
50th percentile
2 492 
243 K
2 125 
136 K
60th percentile
2 659 
272 K
2 196 
144 K
70th percentile
2 839 
292 K
2 346 
153 K
80th percentile
2 930 
316 K
2 449 
175 K
90th percentile
3 323 
390 K
2 648 
199 K

National and departmental comparison

Evolution of the median price per m² of houses

Evolution of the median price per m² of apartments

Quarterly evolution

Evolution of the median price per m²

Evolution of the number of transactions

Quarterly data

Descending order
Quarter
Houses
house
transactions
Houses
house
Price per m²
Apartments
apt.
transactions
Apartments
apt.
Price per m²
2025 Q2
9
2 526 
37
2 125 
2025 Q1
7
2 654 
68
2 162 
2024 Q4
15
2 408 
53
2 121 
2024 Q3
19
2 452 
62
2 168 
2024 Q2
13
2 643 
45
2 005 
2024 Q1
10
2 524 
43
2 037 
2023 Q4
21
2 506 
47
1 991 
2023 Q3
20
2 701 
47
2 072 
2023 Q2
12
2 065 
54
2 150 
2023 Q1
15
2 843 
62
2 143 
2022 Q4
14
2 410 
53
2 111 
2022 Q3
29
2 545 
91
1 950 
2022 Q2
17
2 151 
78
1 966 
2022 Q1
21
2 155 
61
1 910 
2021 Q4
17
1 954 
72
1 903 
2021 Q3
31
2 200 
88
1 900 
2021 Q2
27
2 107 
89
1 827 
2021 Q1
15
2 174 
61
1 802 
2020 Q4
14
2 105 
80
1 766 
2020 Q3
19
2 083 
75
1 709 
2020 Q2
11
2 198 
68
1 594 
2020 Q1
29
2 010 
52
1 602 
2019 Q4
14
2 128 
50
1 636 
2019 Q3
17
1 914 
68
1 718 
2019 Q2
20
1 831 
60
1 660 
2019 Q1
17
2 054 
66
1 626 
2018 Q4
17
2 350 
50
1 575 
2018 Q3
25
1 844 
58
1 554 
2018 Q2
24
1 886 
46
1 523 
2018 Q1
18
2 230 
42
1 620 
2017 Q4
17
1 765 
40
1 564 
2017 Q3
11
1 767 
57
1 494 
2017 Q2
20
2 069 
51
1 552 
2017 Q1
16
1 894 
61
1 400 
2016 Q4
19
1 974 
41
1 750 
2016 Q3
14
1 978 
60
1 502 
2016 Q2
23
1 720 
44
1 542 
2016 Q1
18
2 269 
35
1 623 
2015 Q4
19
1 980 
43
1 580 
2015 Q3
7
2 038 
51
1 629 
2015 Q2
12
1 845 
45
1 538 
2015 Q1
10
2 024 
24
1 445 
2014 Q4
11
2 090 
28
1 380 
2014 Q3
14
1 964 
44
1 678 
2014 Q2
13
1 758 
44
1 782 
2014 Q1
16
1 720 
27
2 006 

Pyrénées-Atlantiques (64)

Most expensive cities

City
name
Descending orderHouses
house
Price per m²
10 052 
7 465 
7 381 
6 416 
6 300 
6 095 
5 504 
5 458 
5 396 
City
name
Descending orderApartments
apt.
Price per m²
8 335 
7 541 
5 454 
5 412 
5 241 
4 973 
4 853 
4 674 
4 591 

Least expensive cities

City
name
Ascending orderHouses
house
Price per m²
512 
535 
656 
753 
764 
792 
824 
City
name
Ascending orderApartments
apt.
Price per m²
216 
228 
240 
333 
355