emooki
HomePrice mapTransactions
🇬🇧 English🇫🇷 Français🇩🇪 Deutsch🇪🇸 Español🇮🇹 Italiano

Real estate price map


Real estate price map in the municipality of Béhasque-Lapiste, choose a section to see transactions by parcel.

Pyrénées-Atlantiques (64)
Béhasque-Lapiste

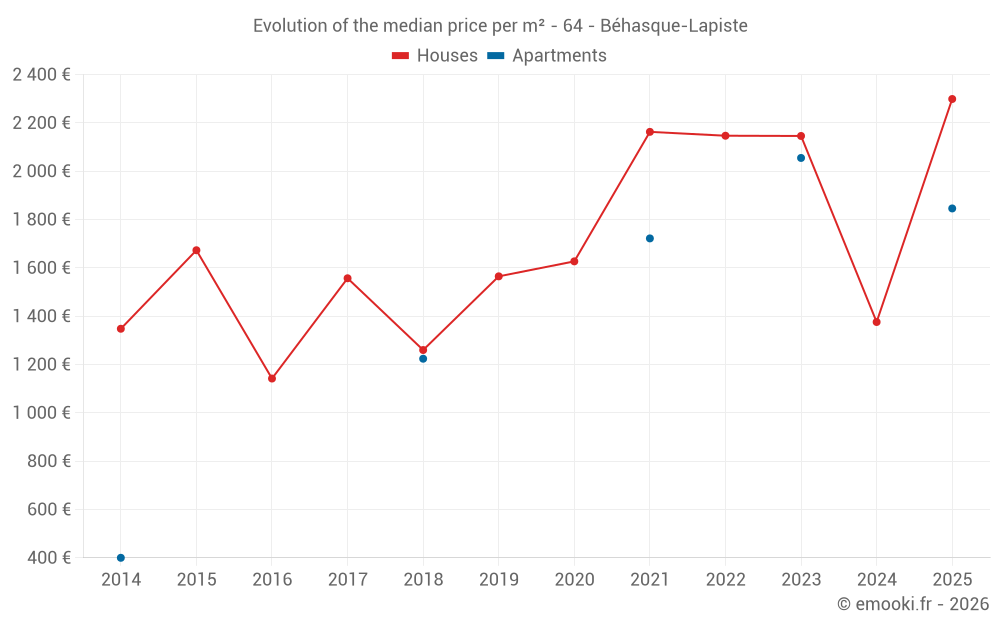
Median price of real estate
in the municipality of Béhasque-Lapiste

HousesHouses
2 092  /m²
1-23-45-67-89-10
Reliability 5/10
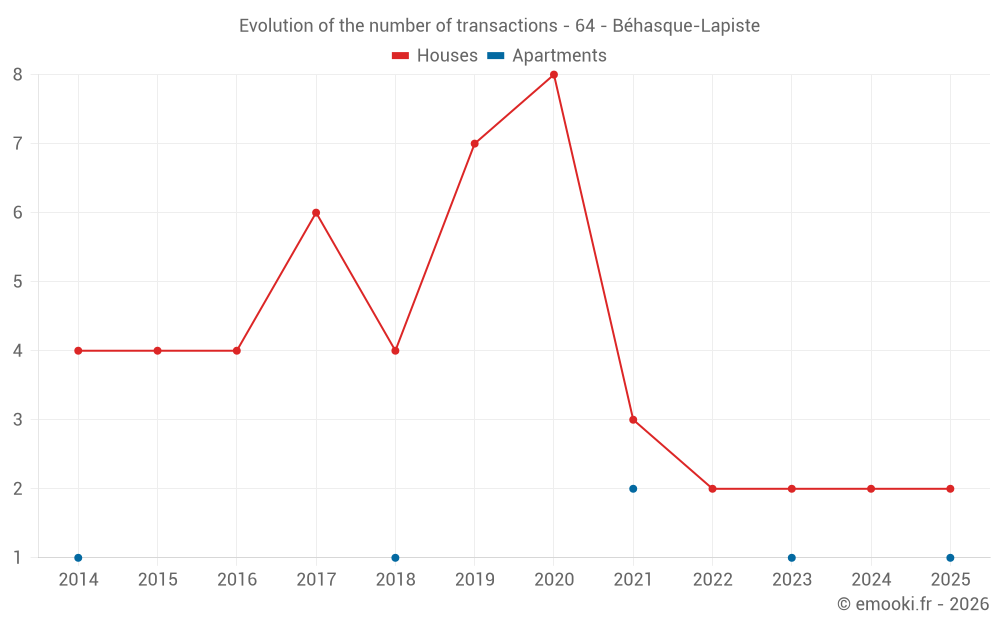
Median price on the 11 transactions of the last 48 months.
from 1 777 to
2 517  /m²
60% of transactions from the 2nd to the 8th deciles.
ApartmentsApartments
1 846  /m²
1-23-45-67-89-10
Reliability 2/10
Median price on the 5 transactions of the last 96 months.
DwellingsDwellings
2 055  /m²
1-23-45-67-89-10
Reliability 5/10
Median price on the 13 transactions of the last 48 months.
from 1 786 to
2 390  /m²
60% of transactions from the 2nd to the 8th deciles.

Yearly evolution

Evolution of the median price per m²

Evolution of the number of transactions

Warning, last year incomplete. Projections made based on the proportions between semesters of the previous year at the departmental/national level and by type of property.

Yearly data

Descending order
Year
Houses
house
transactions
Houses
house
Price per m²
Apartments
apt.
transactions
Apartments
apt.
Price per m²
2025
2
2 299 
1
1 846 
2024
2
1 376 
0
--- 
2023
2
2 146 
1
2 055 
2022
2
2 147 
0
--- 
2021
3
2 163 
2
1 722 
2020
8
1 627 
0
--- 
2019
7
1 565 
0
--- 
2018
4
1 260 
1
1 224 
2017
6
1 557 
0
--- 
2016
4
1 142 
0
--- 
2015
4
1 673 
0
--- 
2014
4
1 348 
1
400 

Analysis

Structure of prices per m²

Values of price percentiles per m² over the periods used for the estimated price of each type of property.

Structure of transaction amounts

Values of transaction amounts percentiles over the periods used for the estimated price of each type of property.

Transaction amounts and prices per m² by percentile

Ascending order
Percentile
Houses
house
Price per m²
Houses
house
Transaction amount
Apartments
apt.
Price per m²
Apartments
apt.
Transaction amount
10th percentile
1 317 
190 K
1 190 
105 K
20th percentile
1 777 
251 K
1 213 
128 K
30th percentile
1 800 
252 K
1 348 
159 K
40th percentile
1 845 
262 K
1 597 
197 K
50th percentile
2 092 
270 K
1 846 
235 K
60th percentile
2 163 
286 K
1 930 
237 K
70th percentile
2 200 
299 K
2 013 
239 K
80th percentile
2 517 
305 K
2 100 
252 K
90th percentile
2 714 
330 K
2 189 
276 K

National and departmental comparison

Evolution of the median price per m² of houses

Evolution of the median price per m² of apartments

Quarterly evolution

Evolution of the median price per m²

Evolution of the number of transactions

Quarterly data

Descending order
Quarter
Houses
house
transactions
Houses
house
Price per m²
Apartments
apt.
transactions
Apartments
apt.
Price per m²
2025 Q2
1
1 800 
1
1 846 
2025 Q1
1
2 798 
0
--- 
2024 Q4
1
907 
0
--- 
2024 Q3
1
1 845 
0
--- 
2023 Q4
1
2 200 
0
--- 
2023 Q3
1
2 092 
0
--- 
2023 Q1
0
--- 
1
2 055 
2022 Q4
1
1 777 
0
--- 
2022 Q3
1
2 517 
0
--- 
2021 Q4
1
2 163 
0
--- 
2021 Q3
2
2 016 
0
--- 
2021 Q2
0
--- 
2
1 722 
2020 Q4
3
2 246 
0
--- 
2020 Q3
2
1 581 
0
--- 
2020 Q1
3
1 398 
0
--- 
2019 Q4
2
2 204 
0
--- 
2019 Q3
1
822 
0
--- 
2019 Q1
4
1 452 
0
--- 
2018 Q3
2
1 730 
1
1 224 
2018 Q1
2
1 108 
0
--- 
2017 Q4
1
1 771 
0
--- 
2017 Q3
4
1 566 
0
--- 
2017 Q1
1
1 136 
0
--- 
2016 Q4
1
1 135 
0
--- 
2016 Q2
3
1 148 
0
--- 
2015 Q3
2
1 964 
0
--- 
2015 Q2
1
1 728 
0
--- 
2015 Q1
1
799 
0
--- 
2014 Q4
1
1 247 
0
--- 
2014 Q2
2
1 244 
0
--- 
2014 Q1
1
1 448 
1
400 

Overview of the latest real estate transactions

The following list is an anonymized overview of the latest transactions. For more details and to find all transactions, please use the map to view transactions by plot or the transaction search page for a search by criteria.

2025-05-26
240 000 
1 846  /m²(130 m²)
Sale
1 outbuilding
Land
395 m2
-Sols
Apartments
Apartment
6 rooms
110 m2
Apartments
Apartment
1 room
20 m2
2 outbuildings
Land
682 m2
-Sols
Land
465 m2
-Prés
Land
750 m2
-Jardins
/Jardin potager
Land
356 m2
-Prés
Land
7802 m2
-Prés
2025-05-26
270 000 
1 800  /m²(150 m²)
Sale
Houses
House
5 rooms
150 m2
Land
827 m2
-Sols
2025-03-13
86 000 
Sale
Land
3070 m2
-Terres
2025-02-20
305 000 
2 798  /m²(109 m²)
Sale
Houses
House
5 rooms
109 m2
1 outbuilding
Land
160 m2
-Sols
Land
927 m2
-Jardins
/Jardin potager
2025-02-11
1 0
Sale
Commercial property
1900 m2
Land
2016 m2
-Sols
Land
577 m2
-Sols
Land
2611 m2
-Sols
Land
869 m2
-Sols
Land
354 m2
-Sols
2025-01-31
66 000 
Sale
Land
1265 m2
-Prés
2024-11-27
78 000 
907  /m²(86 m²)
Sale
Houses
House
4 rooms
86 m2
1 outbuilding
Land
822 m2
-Sols
2024-11-07
65 000 
Sale
Land
1856 m2
-Terres
2024-09-19
286 000 
1 845  /m²(155 m²)
Sale
Houses
House
7 rooms
155 m2
Land
450 m2
-Sols
Land
606 m2
-Jardins
/Jardin potager
2024-09-06
50 000 
Sale
Land
1258 m2
-Prés
2024-09-05
218 000 
1 817  /m²(120 m²)
Sale
Houses
House
6 rooms
120 m2
Commercial property
Land
655 m2
-Jardins
/Jardin potager
Land
432 m2
-Sols
2024-09-03
70 000 
Sale
Land
1261 m2
-Prés
2024-06-26
110 000 
Sale
Land
16771 m2
-Terres
2024-03-29
480 000 
2 182  /m²(220 m²)
4 000  /m²(120 m²)
Sale
Apartments
Apartment
5 rooms
120 m2
Commercial property
100 m2
2 outbuildings
Land
792 m2
-Sols
Land
544 m2
-Terrains d'agrément
Land
778 m2
-Terrains d'agrément
Land
805 m2
-Terres
2024-01-03
62 900 
Sale
Land
2169 m2
-Terrains à bâtir
Land
54 m2
-Sols
2023-12-27
330 000 
2 200  /m²(150 m²)
Sale
Houses
House
4 rooms
150 m2
1 outbuilding
Land
1040 m2
-Sols
Land
11 m2
-Sols
Land
460 m2
-Terrains d'agrément
Land
2 m2
-Sols
2023-12-19
1 0
Sale
Commercial property
550 m2
Land
3804 m2
-Sols
2023-11-07
56 000 
Sale
Land
39 m2
-Terres
2023-07-05
251 000 
2 092  /m²(120 m²)
Sale
Houses
House
5 rooms
120 m2
Land
1031 m2
-Terrains d'agrément
Land
500 m2
-Sols
2023-03-27
300 000 
2 055  /m²(146 m²)
Sale
Apartments
Apartment
5 rooms
96 m2
Apartments
Apartment
2 rooms
50 m2
2 outbuildings
Land
110 m2
-Sols
Land
1083 m2
-Jardins
/Jardin potager
105 transactions listed in the municipality

Pyrénées-Atlantiques (64)

Most expensive cities

City
name
Descending orderHouses
house
Price per m²
10 052 
7 465 
7 381 
6 416 
6 300 
6 095 
5 504 
5 458 
5 396 
City
name
Descending orderApartments
apt.
Price per m²
8 335 
7 541 
5 454 
5 412 
5 241 
4 973 
4 853 
4 674 
4 591 

Least expensive cities

City
name
Ascending orderHouses
house
Price per m²
512 
535 
656 
753 
764 
792 
824 
City
name
Ascending orderApartments
apt.
Price per m²
216 
228 
240 
333 
355