emooki
HomePrice mapTransactions
🇬🇧 English🇫🇷 Français🇩🇪 Deutsch🇪🇸 Español🇮🇹 Italiano

Real estate price map


Real estate price map in the municipality of Nay, choose a section to see transactions by parcel.

Pyrénées-Atlantiques (64)

Nay - Real estate price m²

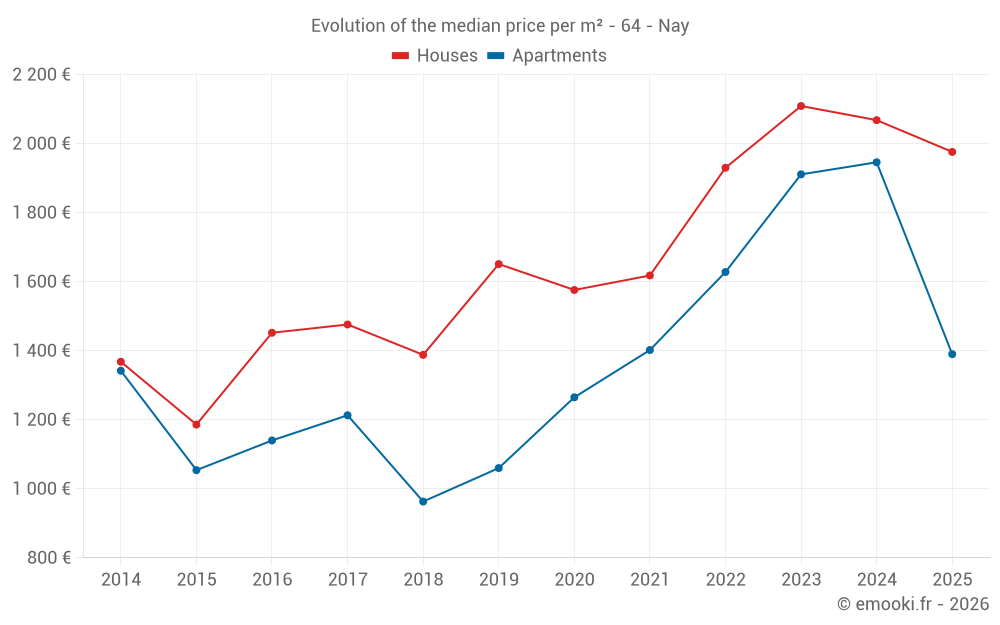
Median price of real estate
in the municipality of Nay

HousesHouses
1 976  /m²
1-23-45-67-89-10
Reliability 8/10
Median price on the 25 transactions of the last 12 months.
from 1 464 to
2 909  /m²
60% of transactions from the 2nd to the 8th deciles.
ApartmentsApartments
1 690  /m²
1-23-45-67-89-10
Reliability 8/10
Median price on the 19 transactions of the last 12 months.
from 1 106 to
2 108  /m²
60% of transactions from the 2nd to the 8th deciles.
DwellingsDwellings
1 898  /m²
1-23-45-67-89-10
Reliability 8/10
Median price on the 44 transactions of the last 12 months.
from 1 215 to
2 333  /m²
60% of transactions from the 2nd to the 8th deciles.
ApartmentsEvolution of the price per m² of apartments since...
1 year
-29%
2 years
-27%
3 years
-15%
4 years
-0.9%
5 years
+10%
6 years
+31%
7 years
+44%
8 years
+15%
9 years
+22%
10 years
+32%
11 years
+3.6%
The price per m² of apartments has decreased by 29% since 1 year, but it has increased by 44% in 7 years.

Yearly evolution

Evolution of the median price per m²

Evolution of the median price per m² - 64 - Nay

Evolution of the number of transactions

Warning, last year incomplete. Projections made based on the proportions between semesters of the previous year at the departmental/national level and by type of property.

Evolution of the number of transactions - 64 - Nay

Yearly data

Descending order
Year
Houses
house
transactions
Houses
house
Price per m²
Apartments
apt.
transactions
Apartments
apt.
Price per m²
2025
3
1 976 
10
1 390 
2024
32
2 068 
17
1 946 
2023
23
2 109 
24
1 911 
2022
40
1 930 
25
1 628 
2021
36
1 618 
24
1 402 
2020
28
1 576 
17
1 265 
2019
31
1 651 
16
1 060 
2018
28
1 388 
17
963 
2017
22
1 476 
20
1 213 
2016
15
1 452 
14
1 140 
2015
21
1 186 
22
1 054 
2014
18
1 368 
10
1 342 

Analysis

Structure of prices per m²

Values of price percentiles per m² over the periods used for the estimated price of each type of property.

Structure of transaction amounts

Values of transaction amounts percentiles over the periods used for the estimated price of each type of property.

Transaction amounts and prices per m² by percentile

Ascending order
Percentile
Houses
house
Price per m²
Houses
house
Transaction amount
Apartments
apt.
Price per m²
Apartments
apt.
Transaction amount
10th percentile
991 
128 K
959 
59 800 
20th percentile
1 464 
149 K
1 106 
70 040 
30th percentile
1 659 
169 K
1 281 
75 400 
40th percentile
1 887 
175 K
1 409 
76 340 
50th percentile
1 976 
229 K
1 690 
78 900 
60th percentile
2 161 
249 K
1 863 
79 800 
70th percentile
2 358 
280 K
1 964 
88 560 
80th percentile
2 909 
312 K
2 108 
107 K
90th percentile
3 141 
428 K
2 190 
116 K

National and departmental comparison

Evolution of the median price per m² of houses

Evolution of the median price per m² of apartments

Quarterly evolution

Evolution of the median price per m²

Evolution of the number of transactions

Quarterly data

Descending order
Quarter
Houses
house
transactions
Houses
house
Price per m²
Apartments
apt.
transactions
Apartments
apt.
Price per m²
2025 Q2
0
--- 
3
987 
2025 Q1
3
1 976 
7
1 690 
2024 Q4
10
1 775 
4
2 116 
2024 Q3
12
2 265 
5
1 727 
2024 Q2
2
1 136 
5
1 538 
2024 Q1
8
2 214 
3
2 190 
2023 Q4
5
2 049 
5
2 157 
2023 Q3
7
2 153 
9
1 639 
2023 Q2
5
1 900 
6
2 114 
2023 Q1
6
1 970 
4
2 006 
2022 Q4
8
1 463 
6
1 833 
2022 Q3
8
1 742 
8
1 486 
2022 Q2
13
2 049 
5
1 438 
2022 Q1
11
2 125 
6
1 803 
2021 Q4
7
1 643 
6
1 461 
2021 Q3
16
1 712 
10
1 502 
2021 Q2
7
1 459 
6
866 
2021 Q1
6
1 531 
2
826 
2020 Q4
7
1 268 
6
746 
2020 Q3
13
1 792 
6
1 364 
2020 Q2
3
1 111 
4
826 
2020 Q1
5
1 564 
1
2 314 
2019 Q4
6
1 366 
4
1 250 
2019 Q3
7
1 414 
6
1 061 
2019 Q2
10
1 678 
4
866 
2019 Q1
8
1 781 
2
1 058 
2018 Q4
6
1 278 
3
922 
2018 Q3
11
1 203 
5
1 039 
2018 Q2
6
1 571 
6
752 
2018 Q1
5
1 877 
3
1 026 
2017 Q4
5
1 474 
6
994 
2017 Q3
5
1 412 
6
1 218 
2017 Q2
5
1 609 
4
1 212 
2017 Q1
7
1 586 
4
1 530 
2016 Q4
4
1 290 
3
1 084 
2016 Q3
4
1 309 
5
2 000 
2016 Q2
0
--- 
5
1 035 
2016 Q1
7
1 618 
1
650 
2015 Q4
7
1 106 
6
1 110 
2015 Q3
4
1 422 
7
1 077 
2015 Q2
7
1 186 
3
1 486 
2015 Q1
3
1 655 
6
734 
2014 Q4
8
1 349 
1
789 
2014 Q3
1
1 917 
3
1 275 
2014 Q2
4
1 344 
2
1 492 
2014 Q1
5
1 450 
4
1 322 

Overview of the latest real estate transactions

The following list is an anonymized overview of the latest transactions. For more details and to find all transactions, please use the map to view transactions by plot or the transaction search page for a search by criteria.

2025-06-02
61 000 
1 488  /m²(41 m²)
Sale
Apartments
Apartment
3 rooms
41 m2
1 outbuilding
2025-05-16
1 
Sale
Land
22 m2
-Sols
Land
1315 m2
-Sols
2025-04-30
80 500 
1 118  /m²(72 m²)
Sale
Commercial property
72 m2
2025-04-28
93 000 
608  /m²(153 m²)
Sale
Apartments
Apartment
3 rooms
59 m2
Apartments
Apartment
2 rooms
38 m2
Apartments
Apartment
3 rooms
56 m2
4 outbuildings
Land
295 m2
-Sols
2025-04-24
288 000 
1 419  /m²(203 m²)
1 920  /m²(150 m²)
Sale
Apartments
Apartment
6 rooms
150 m2
Commercial property
53 m2
4 outbuildings
Land
890 m2
-Sols
2025-04-11
3 800 
Sale
Land
2401 m2
-Prés
2025-04-02
67 100 
987  /m²(68 m²)
Sale
Apartments
Apartment
3 rooms
68 m2
2025-03-19
118 000 
3 105  /m²(38 m²)
Sale
Apartments
Apartment
3 rooms
38 m2
Land
185 m2
-Terrains d'agrément
2025-02-27
75 000 
1 974  /m²(38 m²)
Sale
Apartments
Apartment
2 rooms
38 m2
1 outbuilding
2025-02-21
282 000 
1 868  /m²(151 m²)
Sale
Houses
House
5 rooms
151 m2
Land
692 m2
-Sols
2025-02-11
72 000 
1 075  /m²(67 m²)
Sale
Apartments
Apartment
3 rooms
67 m2
2025-02-11
249 000 
1 976  /m²(126 m²)
Sale
Houses
House
6 rooms
126 m2
1 outbuilding
Land
714 m2
-Sols
2025-02-07
55 000 
1 897  /m²(29 m²)
Sale
Apartments
Apartment
1 room
29 m2
2025-02-04
185 000 
623  /m²(297 m²)
1 947  /m²(95 m²)
Sale
Houses
House
6 rooms
95 m2
Commercial property
202 m2
Land
1548 m2
-Sols
2025-01-28
40 550 
1 690  /m²(24 m²)
Sale
Apartments
Apartment
1 room
24 m2
1 outbuilding
2025-01-13
192 779 
75  /m²(2562 m²)
Sale
Commercial property
105 m2
Commercial property
1679 m2
Commercial property
778 m2
Land
6168 m2
-Sols
Land
237 m2
-Prés
Land
3154 m2
-Sols
Land
90 m2
-Sols
2025-01-13
600 000 
234  /m²(2562 m²)
Sale
Commercial property
778 m2
Commercial property
105 m2
Commercial property
1679 m2
Land
6168 m2
-Sols
Land
237 m2
-Prés
Land
3154 m2
-Sols
Land
90 m2
-Sols
2025-01-10
176 000 
2 120  /m²(83 m²)
Sale
Houses
House
3 rooms
83 m2
1 outbuilding
Land
1000 m2
-Sols
2025-01-08
77 500 
1 292  /m²(60 m²)
Sale
Apartments
Apartment
2 rooms
60 m2
2025-01-08
150 
Exchange
Land
3 m2
-Terrains à bâtir
Land
4 m2
-Terrains à bâtir
Land
7 m2
-Terrains à bâtir
698 transactions listed in the municipality

Pyrénées-Atlantiques (64)

Most expensive cities

City
name
Descending orderHouses
house
Price per m²
10 052 
7 465 
7 381 
6 416 
6 300 
6 095 
5 504 
5 458 
5 396 
City
name
Descending orderApartments
apt.
Price per m²
8 335 
7 541 
5 454 
5 412 
5 241 
4 973 
4 853 
4 674 
4 591 

Least expensive cities

City
name
Ascending orderHouses
house
Price per m²
512 
535 
656 
753 
764 
792 
824 
City
name
Ascending orderApartments
apt.
Price per m²
216 
228 
240 
333 
355