emooki
HomePrice mapTransactions
🇬🇧 English🇫🇷 Français🇩🇪 Deutsch🇪🇸 Español🇮🇹 Italiano

Real estate price map


Real estate price map in the municipality of Rontignon, choose a section to see transactions by parcel.

Pyrénées-Atlantiques (64)

Rontignon - Real estate price m²

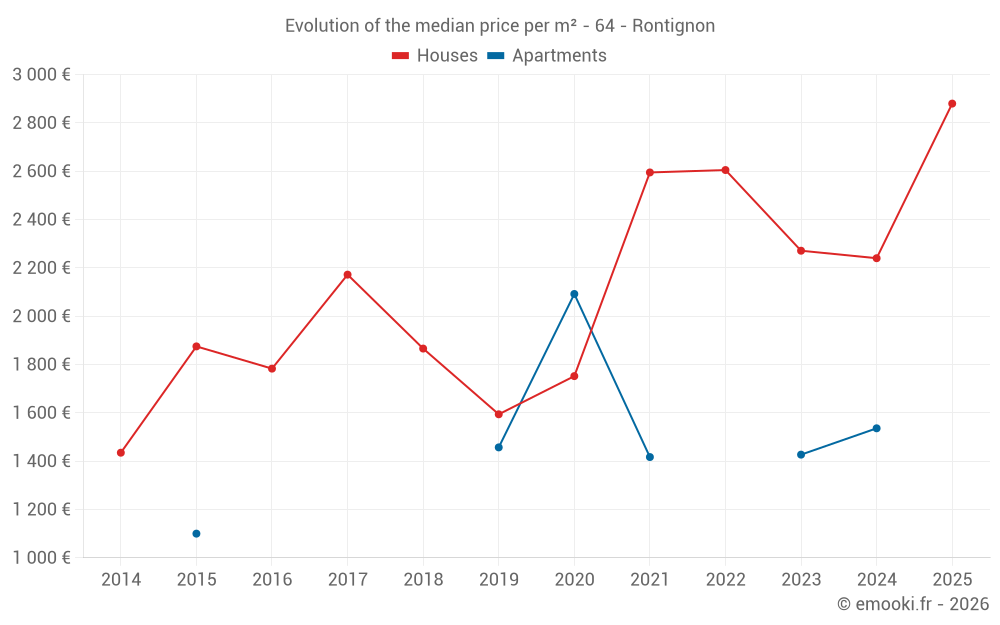
Median price of real estate
in the municipality of Rontignon

HousesHouses
2 609  /m²
1-23-45-67-89-10
Reliability 6/10
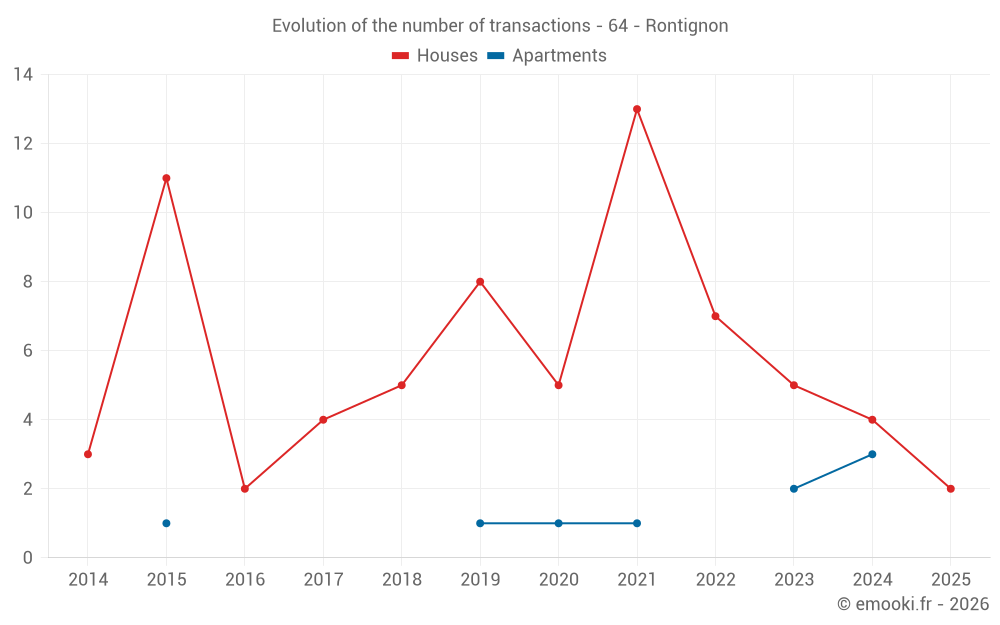
Median price on the 15 transactions of the last 36 months.
from 1 974 to
2 968  /m²
60% of transactions from the 2nd to the 8th deciles.
ApartmentsApartments
1 527  /m²
1-23-45-67-89-10
Reliability 3/10
Median price on the 7 transactions of the last 72 months.
DwellingsDwellings
2 338  /m²
1-23-45-67-89-10
Reliability 6/10
Median price on the 20 transactions of the last 36 months.
from 1 534 to
2 901  /m²
60% of transactions from the 2nd to the 8th deciles.

Yearly evolution

Evolution of the median price per m²

Evolution of the median price per m² - 64 - Rontignon

Evolution of the number of transactions

Warning, last year incomplete. Projections made based on the proportions between semesters of the previous year at the departmental/national level and by type of property.

Evolution of the number of transactions - 64 - Rontignon

Yearly data

Descending order
Year
Houses
house
transactions
Houses
house
Price per m²
Apartments
apt.
transactions
Apartments
apt.
Price per m²
2025
2
2 880 
0
--- 
2024
4
2 240 
3
1 536 
2023
5
2 271 
2
1 427 
2022
7
2 605 
0
--- 
2021
13
2 595 
1
1 417 
2020
5
1 752 
1
2 092 
2019
8
1 594 
1
1 457 
2018
5
1 866 
0
--- 
2017
4
2 172 
0
--- 
2016
2
1 783 
0
--- 
2015
11
1 875 
1
1 100 
2014
3
1 435 
0
--- 

Analysis

Structure of prices per m²

Values of price percentiles per m² over the periods used for the estimated price of each type of property.

Structure of transaction amounts

Values of transaction amounts percentiles over the periods used for the estimated price of each type of property.

Transaction amounts and prices per m² by percentile

Ascending order
Percentile
Houses
house
Price per m²
Houses
house
Transaction amount
Apartments
apt.
Price per m²
Apartments
apt.
Transaction amount
10th percentile
1 715 
205 K
1 313 
84 464 
20th percentile
1 974 
236 K
1 345 
96 100 
30th percentile
2 298 
259 K
1 399 
129 K
40th percentile
2 483 
284 K
1 461 
142 K
50th percentile
2 609 
301 K
1 527 
145 K
60th percentile
2 737 
310 K
1 532 
161 K
70th percentile
2 882 
327 K
1 544 
173 K
80th percentile
2 968 
335 K
1 567 
177 K
90th percentile
3 504 
358 K
1 782 
224 K

National and departmental comparison

Evolution of the median price per m² of houses

Evolution of the median price per m² of apartments

Quarterly evolution

Evolution of the median price per m²

Evolution of the number of transactions

Quarterly data

Descending order
Quarter
Houses
house
transactions
Houses
house
Price per m²
Apartments
apt.
transactions
Apartments
apt.
Price per m²
2025 Q1
2
2 880 
0
--- 
2024 Q4
1
1 871 
1
1 536 
2024 Q3
1
2 609 
0
--- 
2024 Q2
1
2 674 
2
1 433 
2024 Q1
1
1 415 
0
--- 
2023 Q4
1
1 611 
1
1 327 
2023 Q2
3
2 271 
1
1 527 
2023 Q1
1
2 895 
0
--- 
2022 Q4
3
2 535 
0
--- 
2022 Q3
1
3 750 
0
--- 
2022 Q2
2
1 626 
0
--- 
2022 Q1
1
2 621 
0
--- 
2021 Q4
3
3 097 
0
--- 
2021 Q3
7
2 660 
0
--- 
2021 Q2
2
1 118 
1
1 417 
2021 Q1
1
2 215 
0
--- 
2020 Q4
2
1 801 
0
--- 
2020 Q3
1
952 
0
--- 
2020 Q2
1
684 
1
2 092 
2020 Q1
1
2 259 
0
--- 
2019 Q4
2
1 529 
0
--- 
2019 Q3
2
1 724 
0
--- 
2019 Q2
1
2 000 
0
--- 
2019 Q1
3
1 461 
1
1 457 
2018 Q4
1
1 866 
0
--- 
2018 Q3
2
2 000 
0
--- 
2018 Q2
2
1 866 
0
--- 
2017 Q4
1
1 981 
0
--- 
2017 Q3
3
2 363 
0
--- 
2016 Q4
1
1 523 
0
--- 
2016 Q1
1
2 043 
0
--- 
2015 Q4
4
2 080 
0
--- 
2015 Q3
6
1 866 
1
1 100 
2015 Q1
1
667 
0
--- 
2014 Q4
1
1 181 
0
--- 
2014 Q3
1
1 673 
0
--- 
2014 Q2
1
1 435 
0
--- 

Overview of the latest real estate transactions

The following list is an anonymized overview of the latest transactions. For more details and to find all transactions, please use the map to view transactions by plot or the transaction search page for a search by criteria.

2025-05-22
93 661 
Sale
Land
4031 m2
-Terres
2025-04-17
1 018 
Sale
Land
828 m2
-Prés
2025-04-09
76 262 
Sale
Land
503 m2
-Terrains à bâtir
2025-03-26
360 000 
2 927  /m²(123 m²)
Sale
Houses
House
4 rooms
123 m2
Land
605 m2
-Sols
Land
25 m2
-Sols
2025-02-13
354 000 
2 832  /m²(125 m²)
Sale
Houses
House
5 rooms
125 m2
1 outbuilding
Land
1001 m2
-Sols
2025-02-10
30 067 
Sale
Land
7820 m2
-Terres
Land
3415 m2
-Terres
Land
12440 m2
-Terres
2025-01-20
14 482 
Sale
Land
4691 m2
-Prés
Land
6712 m2
-Terres
2024-12-30
172 000 
1 536  /m²(112 m²)
Sale
Apartments
Apartment
4 rooms
112 m2
2 outbuildings
2024-10-16
45 000 
Sale
Land
14450 m2
-Terres
Land
6635 m2
-Landes
/Pâture plantée
2024-10-07
196 450 
1 871  /m²(105 m²)
Sale
Houses
House
5 rooms
105 m2
Land
197 m2
-Terrains d'agrément
Land
500 m2
-Sols
2024-08-12
240 000 
2 609  /m²(92 m²)
Sale
Houses
House
4 rooms
92 m2
Land
500 m2
-Sols
Land
820 m2
-Terrains d'agrément
2024-07-04
2 908 
Sale
Land
2364 m2
-Terres
2024-06-03
328 911 
2 674  /m²(123 m²)
Sale
Houses
House
4 rooms
123 m2
1 outbuilding
Land
2477 m2
-Prés
Land
1599 m2
-Taillis simples
Land
1000 m2
-Sols
2024-05-31
2 500 
Sale
Land
10065 m2
-Landes boisées
/Touyas
2024-05-07
355 000 
Sale
Land
638 m2
-Terres
Land
28 m2
-Terres
2024-04-25
144 860 
1 575  /m²(92 m²)
Sale
Apartments
Apartment
3 rooms
92 m2
2 outbuildings
2024-04-11
178 100 
1 291  /m²(138 m²)
Sale
Apartments
Apartment
3 rooms
69 m2
Apartments
Apartment
3 rooms
69 m2
2 outbuildings
Land
57 m2
-Jardins
2024-03-27
283 000 
1 415  /m²(200 m²)
Sale
Houses
House
7 rooms
200 m2
Land
550 m2
-Sols
Land
510 m2
-Jardins
2024-03-15
6 000 
Sale
Land
9055 m2
-Taillis simples
Land
7179 m2
-Taillis simples
Land
12365 m2
-Taillis simples
2024-01-30
30 000 
Sale
Land
1500 m2
-Sols
Land
940 m2
-Jardins
Land
12888 m2
-Prés
168 transactions listed in the municipality

Pyrénées-Atlantiques (64)

Most expensive cities

City
name
Descending orderHouses
house
Price per m²
10 052 
7 465 
7 381 
6 416 
6 300 
6 095 
5 504 
5 458 
5 396 
City
name
Descending orderApartments
apt.
Price per m²
8 335 
7 541 
5 454 
5 412 
5 241 
4 973 
4 853 
4 674 
4 591 

Least expensive cities

City
name
Ascending orderHouses
house
Price per m²
512 
535 
656 
753 
764 
792 
824 
City
name
Ascending orderApartments
apt.
Price per m²
216 
228 
240 
333 
355