emooki
HomePrice mapTransactions
🇬🇧 English🇫🇷 Français🇩🇪 Deutsch🇪🇸 Español🇮🇹 Italiano

Real estate price map


Real estate price map in the municipality of Artix, choose a section to see transactions by parcel.

Pyrénées-Atlantiques (64)

Artix - Real estate price m²

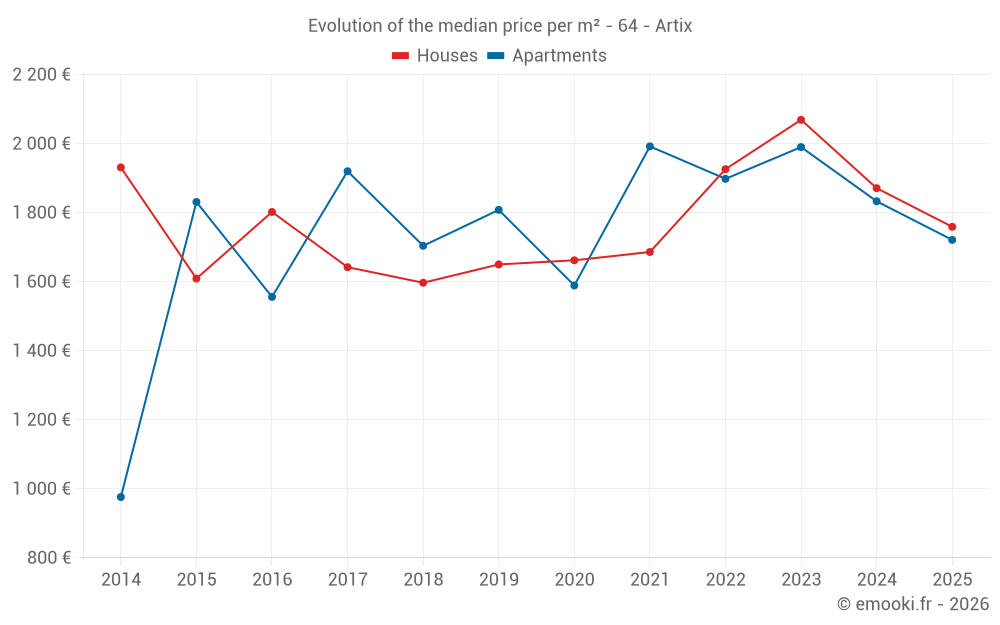
Median price of real estate
in the municipality of Artix

HousesHouses
1 759  /m²
1-23-45-67-89-10
Reliability 8/10
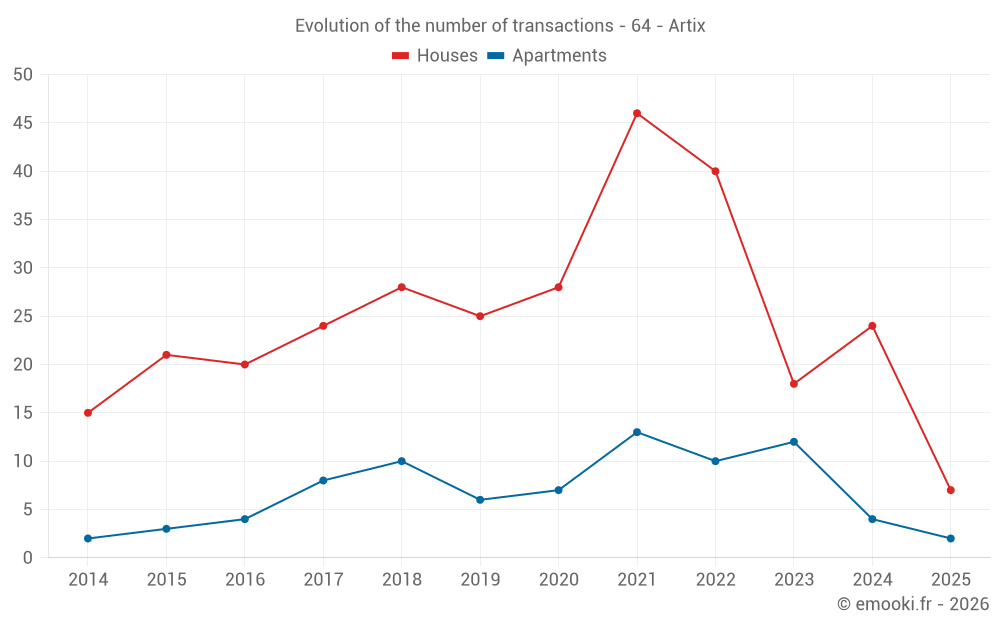
Median price on the 21 transactions of the last 12 months.
from 1 433 to
2 174  /m²
60% of transactions from the 2nd to the 8th deciles.
ApartmentsApartments
1 949  /m²
1-23-45-67-89-10
Reliability 6/10
Median price on the 21 transactions of the last 36 months.
from 1 773 to
2 168  /m²
60% of transactions from the 2nd to the 8th deciles.
DwellingsDwellings
1 769  /m²
1-23-45-67-89-10
Reliability 8/10
Median price on the 24 transactions of the last 12 months.
from 1 459 to
2 170  /m²
60% of transactions from the 2nd to the 8th deciles.
HousesEvolution of the price per m² of houses since...
1 year
-6%
2 years
-15%
3 years
-8.7%
4 years
+4.3%
5 years
+5.8%
6 years
+6.6%
7 years
+10%
8 years
+7.1%
9 years
-2.4%
10 years
+9.3%
11 years
-8.9%
The price per m² of houses has decreased by 15% since 2 years, but it has increased by 10% in 7 years.

Yearly evolution

Evolution of the median price per m²

Evolution of the median price per m² - 64 - Artix

Evolution of the number of transactions

Warning, last year incomplete. Projections made based on the proportions between semesters of the previous year at the departmental/national level and by type of property.

Evolution of the number of transactions - 64 - Artix

Yearly data

Descending order
Year
Houses
house
transactions
Houses
house
Price per m²
Apartments
apt.
transactions
Apartments
apt.
Price per m²
2025
7
1 759 
2
1 721 
2024
24
1 871 
4
1 833 
2023
18
2 069 
12
1 990 
2022
40
1 926 
10
1 898 
2021
46
1 686 
13
1 992 
2020
28
1 662 
7
1 589 
2019
25
1 650 
6
1 808 
2018
28
1 597 
10
1 704 
2017
24
1 642 
8
1 920 
2016
20
1 802 
4
1 556 
2015
21
1 609 
3
1 831 
2014
15
1 931 
2
976 

Analysis

Structure of prices per m²

Values of price percentiles per m² over the periods used for the estimated price of each type of property.

Structure of transaction amounts

Values of transaction amounts percentiles over the periods used for the estimated price of each type of property.

Transaction amounts and prices per m² by percentile

Ascending order
Percentile
Houses
house
Price per m²
Houses
house
Transaction amount
Apartments
apt.
Price per m²
Apartments
apt.
Transaction amount
10th percentile
1 194 
121 K
1 498 
65 000 
20th percentile
1 433 
130 K
1 773 
100 K
30th percentile
1 512 
141 K
1 806 
111 K
40th percentile
1 660 
160 K
1 881 
114 K
50th percentile
1 759 
163 K
1 949 
120 K
60th percentile
1 818 
207 K
2 032 
120 K
70th percentile
1 963 
209 K
2 115 
125 K
80th percentile
2 174 
228 K
2 168 
150 K
90th percentile
2 747 
250 K
2 216 
172 K

National and departmental comparison

Evolution of the median price per m² of houses

Evolution of the median price per m² of apartments

Quarterly evolution

Evolution of the median price per m²

Evolution of the number of transactions

Quarterly data

Descending order
Quarter
Houses
house
transactions
Houses
house
Price per m²
Apartments
apt.
transactions
Apartments
apt.
Price per m²
2025 Q2
3
1 759 
2
1 721 
2025 Q1
4
1 739 
0
--- 
2024 Q4
9
1 779 
1
2 168 
2024 Q3
5
1 194 
0
--- 
2024 Q2
8
2 258 
1
1 498 
2024 Q1
2
2 202 
2
1 631 
2023 Q4
8
2 069 
1
2 778 
2023 Q3
1
2 335 
3
2 045 
2023 Q2
5
1 842 
3
2 032 
2023 Q1
4
2 057 
5
1 900 
2022 Q4
6
1 738 
1
2 500 
2022 Q3
10
2 238 
2
2 000 
2022 Q2
7
1 938 
3
1 114 
2022 Q1
17
1 914 
4
1 804 
2021 Q4
17
1 847 
6
2 056 
2021 Q3
12
1 710 
4
1 896 
2021 Q2
7
1 652 
1
1 758 
2021 Q1
10
1 372 
2
1 848 
2020 Q4
11
1 632 
2
1 420 
2020 Q3
6
1 812 
3
1 780 
2020 Q2
3
2 089 
1
1 548 
2020 Q1
8
1 550 
1
1 961 
2019 Q4
8
1 240 
3
1 898 
2019 Q3
8
1 902 
1
1 765 
2019 Q2
5
2 021 
1
1 831 
2019 Q1
4
1 613 
1
1 786 
2018 Q4
7
1 391 
2
1 440 
2018 Q3
9
1 409 
2
1 306 
2018 Q2
7
1 826 
2
1 582 
2018 Q1
5
1 571 
4
1 704 
2017 Q4
7
1 663 
2
2 147 
2017 Q3
8
1 408 
1
1 966 
2017 Q2
3
1 732 
4
1 844 
2017 Q1
6
1 430 
1
1 000 
2016 Q4
5
2 135 
0
--- 
2016 Q3
9
1 723 
1
720 
2016 Q2
2
1 607 
2
1 726 
2016 Q1
4
1 832 
1
1 780 
2015 Q4
4
1 628 
0
--- 
2015 Q3
7
1 684 
2
5 165 
2015 Q2
5
1 471 
0
--- 
2015 Q1
5
1 946 
1
1 164 
2014 Q4
7
2 027 
0
--- 
2014 Q3
2
1 390 
0
--- 
2014 Q2
5
1 537 
0
--- 
2014 Q1
1
382 
2
976 

Overview of the latest real estate transactions

The following list is an anonymized overview of the latest transactions. For more details and to find all transactions, please use the map to view transactions by plot or the transaction search page for a search by criteria.

2025-06-20
100 000 
1 563  /m²(64 m²)
Sale
Apartments
Apartment
2 rooms
64 m2
1 outbuilding
2025-05-20
360 000 
1 056  /m²(341 m²)
Sale
Commercial property
255 m2
Commercial property
86 m2
Land
867 m2
-Sols
2025-05-05
295 000 
1 879  /m²(157 m²)
Sale
Apartments
Apartment
5 rooms
157 m2
2 outbuildings
2025-04-30
315 000 
784  /m²(402 m²)
Sale
Commercial property
402 m2
Land
1822 m2
-Sols
Land
32 m2
-Sols
2025-04-28
146 010 
1 759  /m²(83 m²)
Sale
Houses
House
4 rooms
83 m2
1 outbuilding
Land
724 m2
-Sols
Land
211 m2
-Terrains à bâtir
2025-04-25
210 600 
1 433  /m²(147 m²)
Sale
Houses
House
5 rooms
147 m2
Land
802 m2
-Sols
2025-04-10
162 750 
1 849  /m²(88 m²)
Sale
Houses
House
5 rooms
88 m2
Land
350 m2
-Sols
2025-04-09
5 000 
Sale
Land
1396 m2
-Terrains à bâtir
2025-03-26
22 000 
Sale
Land
73 m2
-Sols
Land
48 m2
-Sols
2025-03-21
249 000 
1 660  /m²(150 m²)
Sale
Houses
House
6 rooms
150 m2
3 outbuildings
Land
835 m2
-Sols
Land
591 m2
-Landes
/Terrain vague
2025-03-13
209 050 
2 349  /m²(89 m²)
Sale
Houses
House
5 rooms
89 m2
1 outbuilding
Land
1285 m2
-Sols
2025-02-26
3 000 
Sale
1 outbuilding
2025-02-24
519 355 
Sale
Land
209 m2
-Terrains à bâtir
Land
60 m2
-Terres
Land
2109 m2
-Terrains à bâtir
2025-02-24
531 806 
Sale
Land
6023 m2
-Terrains à bâtir
2025-02-20
160 000 
1 818  /m²(88 m²)
Sale
Houses
House
5 rooms
88 m2
Land
282 m2
-Sols
2025-01-29
125 000 
1 420  /m²(88 m²)
Sale
Houses
House
5 rooms
88 m2
Land
341 m2
-Sols
2025-01-24
330 000 
479  /m²(689 m²)
Sale
Commercial property
689 m2
2025-01-24
108 000 
603  /m²(179 m²)
Sale
Commercial property
179 m2
2024-12-30
130 000 
1 512  /m²(86 m²)
Sale
Houses
House
4 rooms
86 m2
Land
1002 m2
-Sols
Land
1044 m2
-Jardins
Land
1010 m2
-Landes
/Terrain vague
2024-12-26
145 000 
2 589  /m²(56 m²)
Sale
Commercial property
56 m2
Land
267 m2
-Sols
628 transactions listed in the municipality

Pyrénées-Atlantiques (64)

Most expensive cities

City
name
Descending orderHouses
house
Price per m²
10 052 
7 465 
7 381 
6 416 
6 300 
6 095 
5 504 
5 458 
5 396 
City
name
Descending orderApartments
apt.
Price per m²
8 335 
7 541 
5 454 
5 412 
5 241 
4 973 
4 853 
4 674 
4 591 

Least expensive cities

City
name
Ascending orderHouses
house
Price per m²
512 
535 
656 
753 
764 
792 
824 
City
name
Ascending orderApartments
apt.
Price per m²
216 
228 
240 
333 
355