emooki
HomePrice mapTransactions
🇬🇧 English🇫🇷 Français🇩🇪 Deutsch🇪🇸 Español🇮🇹 Italiano

Real estate price map


Real estate price map in the municipality of Aressy, choose a section to see transactions by parcel.

Pyrénées-Atlantiques (64)

Aressy - Real estate price m²

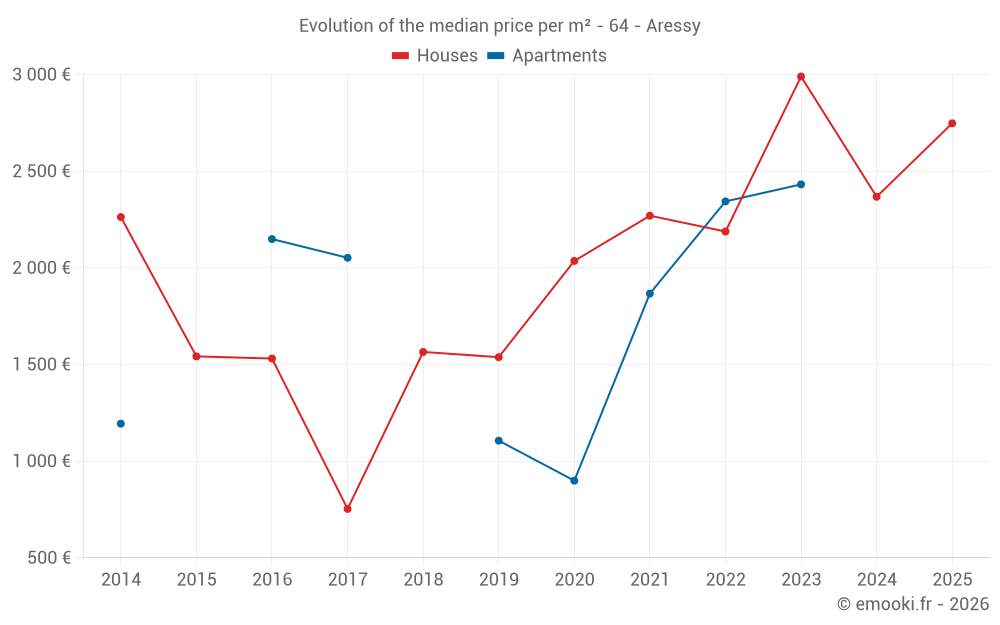
Median price of real estate
in the municipality of Aressy

HousesHouses
2 451  /m²
1-23-45-67-89-10
Reliability 6/10
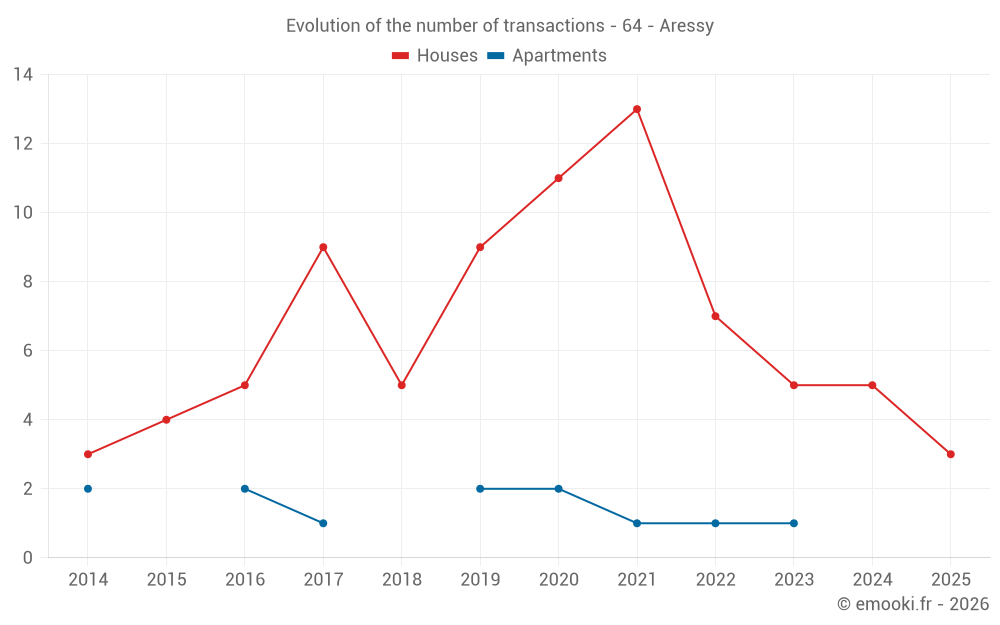
Median price on the 19 transactions of the last 36 months.
from 2 119 to
3 078  /m²
60% of transactions from the 2nd to the 8th deciles.
ApartmentsApartments
1 972  /m²
1-23-45-67-89-10
Reliability 3/10
Median price on the 6 transactions of the last 72 months.
DwellingsDwellings
2 442  /m²
1-23-45-67-89-10
Reliability 6/10
Median price on the 20 transactions of the last 36 months.
from 2 141 to
3 057  /m²
60% of transactions from the 2nd to the 8th deciles.

Yearly evolution

Evolution of the median price per m²

Evolution of the median price per m² - 64 - Aressy

Evolution of the number of transactions

Warning, last year incomplete. Projections made based on the proportions between semesters of the previous year at the departmental/national level and by type of property.

Evolution of the number of transactions - 64 - Aressy

Yearly data

Descending order
Year
Houses
house
transactions
Houses
house
Price per m²
Apartments
apt.
transactions
Apartments
apt.
Price per m²
2025
3
2 748 
0
--- 
2024
5
2 368 
0
--- 
2023
5
2 990 
1
2 432 
2022
7
2 188 
1
2 344 
2021
13
2 270 
1
1 867 
2020
11
2 036 
2
899 
2019
9
1 538 
2
1 106 
2018
5
1 565 
0
--- 
2017
9
753 
1
2 052 
2016
5
1 531 
2
2 149 
2015
4
1 542 
0
--- 
2014
3
2 263 
2
1 194 

Analysis

Structure of prices per m²

Values of price percentiles per m² over the periods used for the estimated price of each type of property.

Structure of transaction amounts

Values of transaction amounts percentiles over the periods used for the estimated price of each type of property.

Transaction amounts and prices per m² by percentile

Ascending order
Percentile
Houses
house
Price per m²
Houses
house
Transaction amount
Apartments
apt.
Price per m²
Apartments
apt.
Transaction amount
10th percentile
1 832 
234 K
899 
146 K
20th percentile
2 119 
256 K
1 161 
160 K
30th percentile
2 218 
274 K
1 514 
170 K
40th percentile
2 356 
284 K
1 867 
181 K
50th percentile
2 451 
289 K
1 972 
184 K
60th percentile
2 857 
318 K
2 078 
187 K
70th percentile
3 012 
331 K
2 211 
191 K
80th percentile
3 078 
393 K
2 344 
195 K
90th percentile
3 491 
501 K
2 388 
210 K

National and departmental comparison

Evolution of the median price per m² of houses

Evolution of the median price per m² of apartments

Quarterly evolution

Evolution of the median price per m²

Evolution of the number of transactions

Quarterly data

Descending order
Quarter
Houses
house
transactions
Houses
house
Price per m²
Apartments
apt.
transactions
Apartments
apt.
Price per m²
2025 Q2
1
3 456 
0
--- 
2025 Q1
2
2 278 
0
--- 
2024 Q3
2
2 702 
0
--- 
2024 Q2
2
2 626 
0
--- 
2024 Q1
1
2 353 
0
--- 
2023 Q3
2
3 534 
1
2 432 
2023 Q2
3
2 451 
0
--- 
2022 Q4
4
2 595 
0
--- 
2022 Q3
2
2 120 
0
--- 
2022 Q2
0
--- 
1
2 344 
2022 Q1
1
2 487 
0
--- 
2021 Q4
2
1 846 
0
--- 
2021 Q3
3
2 398 
0
--- 
2021 Q2
3
2 289 
1
1 867 
2021 Q1
5
2 203 
0
--- 
2020 Q4
3
2 073 
0
--- 
2020 Q3
0
--- 
1
1 161 
2020 Q2
2
1 333 
1
637 
2020 Q1
6
2 020 
0
--- 
2019 Q4
1
622 
1
2 078 
2019 Q3
1
654 
0
--- 
2019 Q2
3
1 489 
1
133 
2019 Q1
4
1 870 
0
--- 
2018 Q4
2
1 099 
0
--- 
2018 Q3
1
1 381 
0
--- 
2018 Q2
1
2 210 
0
--- 
2018 Q1
1
2 303 
0
--- 
2017 Q4
1
753 
0
--- 
2017 Q3
6
992 
0
--- 
2017 Q1
2
1 418 
1
2 052 
2016 Q3
3
1 412 
0
--- 
2016 Q2
2
1 778 
1
2 106 
2016 Q1
0
--- 
1
2 192 
2015 Q4
1
1 804 
0
--- 
2015 Q2
1
887 
0
--- 
2015 Q1
2
1 692 
0
--- 
2014 Q4
1
2 263 
0
--- 
2014 Q3
1
1 689 
0
--- 
2014 Q2
0
--- 
1
1 375 
2014 Q1
1
2 308 
1
1 012 

Overview of the latest real estate transactions

The following list is an anonymized overview of the latest transactions. For more details and to find all transactions, please use the map to view transactions by plot or the transaction search page for a search by criteria.

2025-05-12
340 000 
Sale
Land
1883 m2
-Terrains à bâtir
Land
2915 m2
-Terrains à bâtir
Land
3399 m2
-Terrains à bâtir
Land
143 m2
-Terrains à bâtir
Land
150 m2
-Terrains à bâtir
Land
110 m2
-Terrains à bâtir
2025-04-25
331 800 
3 456  /m²(96 m²)
Sale
Houses
House
4 rooms
96 m2
Land
466 m2
-Sols
2025-03-20
386 885 
1 808  /m²(214 m²)
Sale
Houses
House
9 rooms
214 m2
1 outbuilding
Land
1600 m2
-Terrains d'agrément
Land
600 m2
-Sols
2025-03-14
302 300 
2 748  /m²(110 m²)
Sale
Houses
House
4 rooms
110 m2
Land
492 m2
-Sols
2025-01-10
1 
Sale
Land
677 m2
-Sols
2024-09-11
72 900 
Sale
Land
102 m2
-Terrains à bâtir
Land
338 m2
-Terrains à bâtir
2024-09-10
240 000 
2 264  /m²(106 m²)
Sale
Houses
House
4 rooms
106 m2
Land
1000 m2
-Sols
2024-09-03
86 200 
Sale
Land
578 m2
-Terrains à bâtir
2024-08-22
72 500 
Sale
Land
446 m2
-Terrains à bâtir
2024-07-25
68 000 
Sale
Land
484 m2
-Terrains à bâtir
2024-07-25
45 000 
Sale
Land
902 m2
-Terrains d'agrément
Land
100 m2
-Sols
Land
25 m2
-Sols
Land
28 m2
-Sols
2024-07-19
401 800 
3 139  /m²(128 m²)
Sale
Houses
House
4 rooms
128 m2
1 outbuilding
Land
328 m2
-Sols
Land
199 m2
-Sols
2024-06-19
4 000 
Sale
Land
100 m2
-Sols
Land
440 m2
-Jardins
/Jardin potager
2024-06-14
259 600 
2 884  /m²(90 m²)
Sale
Houses
House
4 rooms
90 m2
Land
502 m2
-Sols
2024-05-30
92 900 
Sale
Land
929 m2
-Terrains à bâtir
2024-04-19
15 
Exchange
Land
103 m2
-Terrains à bâtir
Land
103 m2
-Terres
2024-04-18
270 000 
2 368  /m²(114 m²)
Sale
Houses
House
5 rooms
114 m2
1 outbuilding
Land
1000 m2
-Sols
2024-03-29
1 400 000 
4 403  /m²(318 m²)
Sale
Land
89 m2
-Sols
Commercial property
318 m2
Land
404 m2
-Sols
Land
16 m2
-Sols
2024-03-07
279 950 
2 353  /m²(119 m²)
Sale
Houses
House
4 rooms
119 m2
Land
1052 m2
-Sols
2024-02-01
19 529 
Sale
Land
132 m2
-Taillis simples
263 transactions listed in the municipality

Pyrénées-Atlantiques (64)

Most expensive cities

City
name
Descending orderHouses
house
Price per m²
10 052 
7 465 
7 381 
6 416 
6 300 
6 095 
5 504 
5 458 
5 396 
City
name
Descending orderApartments
apt.
Price per m²
8 335 
7 541 
5 454 
5 412 
5 241 
4 973 
4 853 
4 674 
4 591 

Least expensive cities

City
name
Ascending orderHouses
house
Price per m²
512 
535 
656 
753 
764 
792 
824 
City
name
Ascending orderApartments
apt.
Price per m²
216 
228 
240 
333 
355