emooki
HomePrice mapTransactions
🇬🇧 English🇫🇷 Français🇩🇪 Deutsch🇪🇸 Español🇮🇹 Italiano

Real estate price map


Real estate price map in the municipality of Guéthary.

Pyrénées-Atlantiques (64)
Guéthary

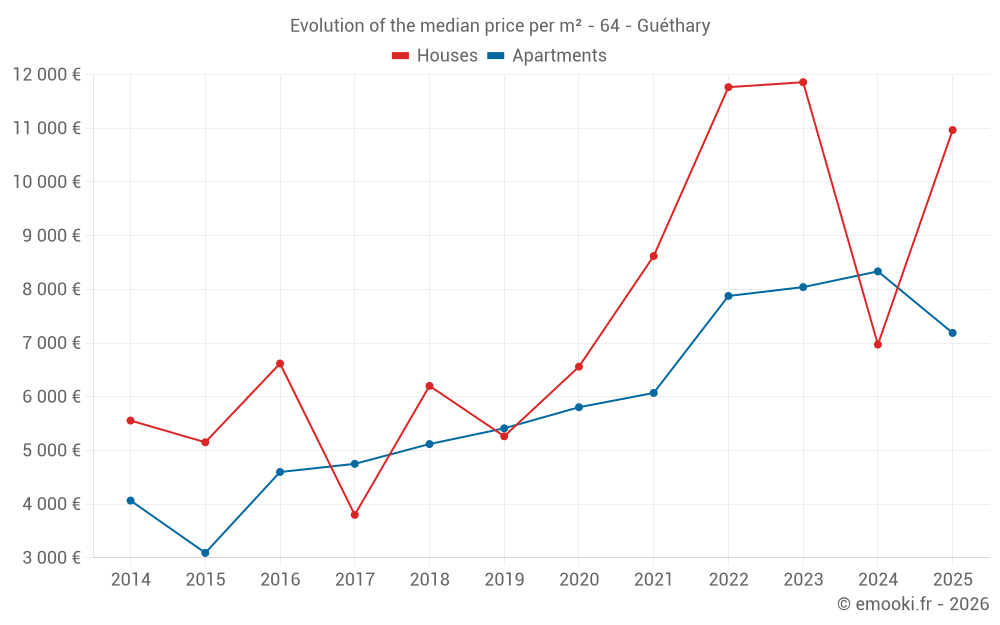
Median price of real estate
in the municipality of Guéthary

HousesHouses
10 052  /m²
1-23-45-67-89-10
Reliability 7/10
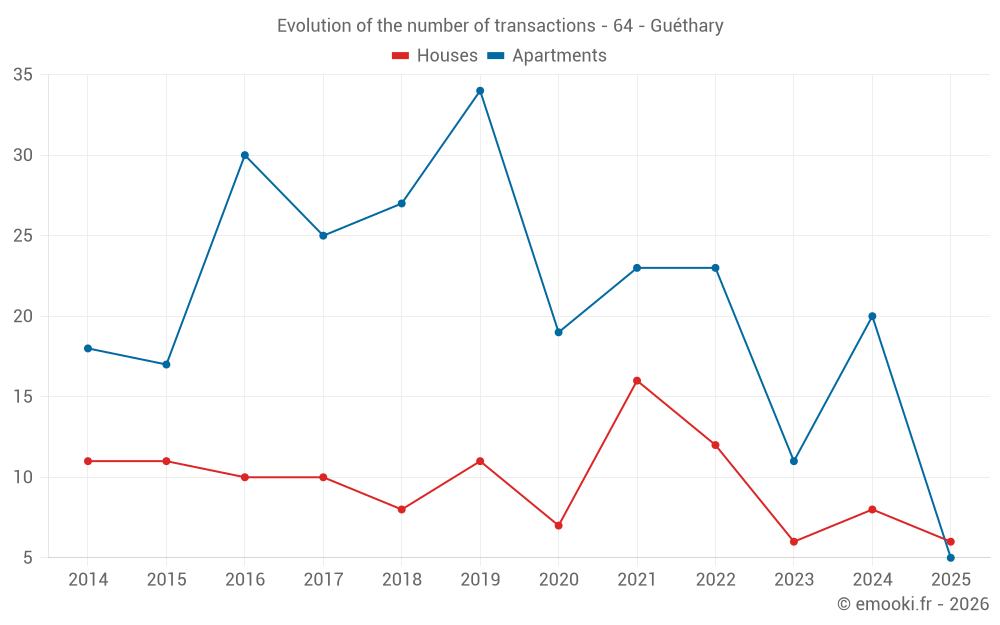
Median price on the 16 transactions of the last 24 months.
from 6 813 to
14 135  /m²
60% of transactions from the 2nd to the 8th deciles.
ApartmentsApartments
8 335  /m²
1-23-45-67-89-10
Reliability 8/10
Median price on the 18 transactions of the last 12 months.
from 6 864 to
12 646  /m²
60% of transactions from the 2nd to the 8th deciles.
DwellingsDwellings
8 335  /m²
1-23-45-67-89-10
Reliability 8/10
Median price on the 28 transactions of the last 12 months.
from 6 996 to
14 055  /m²
60% of transactions from the 2nd to the 8th deciles.
HousesEvolution of the price per m² of houses since...
1 year
+57%
2 years
-7.5%
3 years
-6.8%
4 years
+27%
5 years
+67%
6 years
+108%
7 years
+77%
8 years
+189%
9 years
+66%
10 years
+113%
11 years
+97%
ApartmentsEvolution of the price per m² of apartments since...
1 year
-14%
2 years
-11%
3 years
-8.7%
4 years
+18%
5 years
+24%
6 years
+33%
7 years
+40%
8 years
+51%
9 years
+56%
10 years
+133%
11 years
+77%

Yearly evolution

Evolution of the median price per m²

Evolution of the number of transactions

Warning, last year incomplete. Projections made based on the proportions between semesters of the previous year at the departmental/national level and by type of property.

Yearly data

Descending order
Year
Houses
house
transactions
Houses
house
Price per m²
Apartments
apt.
transactions
Apartments
apt.
Price per m²
2025
6
10 967 
5
7 188 
2024
8
6 972 
20
8 335 
2023
6
11 858 
11
8 042 
2022
12
11 766 
23
7 877 
2021
16
8 621 
23
6 071 
2020
7
6 560 
19
5 805 
2019
11
5 263 
34
5 412 
2018
8
6 202 
27
5 119 
2017
10
3 800 
25
4 750 
2016
10
6 619 
30
4 598 
2015
11
5 152 
17
3 091 
2014
11
5 556 
18
4 066 

Analysis

Structure of prices per m²

Values of price percentiles per m² over the periods used for the estimated price of each type of property.

Structure of transaction amounts

Values of transaction amounts percentiles over the periods used for the estimated price of each type of property.

Transaction amounts and prices per m² by percentile

Ascending order
Percentile
Houses
house
Price per m²
Houses
house
Transaction amount
Apartments
apt.
Price per m²
Apartments
apt.
Transaction amount
10th percentile
6 163 
466 K
4 512 
213 K
20th percentile
6 813 
820 K
6 864 
288 K
30th percentile
7 077 
985 K
7 110 
320 K
40th percentile
7 988 
1 350 K
7 269 
330 K
50th percentile
10 052 
1 500 K
8 335 
418 K
60th percentile
12 579 
2 000 K
8 884 
517 K
70th percentile
13 619 
2 496 K
9 709 
653 K
80th percentile
14 135 
2 790 K
12 646 
725 K
90th percentile
16 149 
3 264 K
14 735 
1 763 K

National and departmental comparison

Evolution of the median price per m² of houses

Evolution of the median price per m² of apartments

Quarterly evolution

Evolution of the median price per m²

Evolution of the number of transactions

Quarterly data

Descending order
Quarter
Houses
house
transactions
Houses
house
Price per m²
Apartments
apt.
transactions
Apartments
apt.
Price per m²
2025 Q2
3
8 000 
1
11 525 
2025 Q1
3
15 081 
4
6 988 
2024 Q4
1
14 135 
7
7 289 
2024 Q3
3
7 130 
6
9 063 
2024 Q2
2
12 015 
3
7 727 
2024 Q1
2
4 340 
4
7 588 
2023 Q4
2
12 704 
4
9 694 
2023 Q3
0
--- 
3
8 500 
2023 Q2
2
10 954 
3
5 938 
2023 Q1
2
15 044 
1
11 034 
2022 Q4
2
12 500 
6
11 672 
2022 Q3
2
14 190 
9
6 483 
2022 Q2
3
8 229 
3
4 976 
2022 Q1
5
11 570 
5
7 877 
2021 Q4
7
8 480 
5
9 088 
2021 Q3
3
10 655 
7
6 400 
2021 Q2
4
7 609 
9
5 069 
2021 Q1
2
5 686 
2
4 108 
2020 Q4
5
8 482 
9
5 805 
2020 Q3
2
5 362 
4
5 739 
2020 Q2
0
--- 
6
4 777 
2019 Q4
3
5 000 
12
6 744 
2019 Q3
3
5 859 
8
5 764 
2019 Q2
4
5 640 
8
4 848 
2019 Q1
1
4 592 
6
5 302 
2018 Q4
5
6 905 
7
6 167 
2018 Q3
2
8 604 
8
39 
2018 Q2
0
--- 
5
5 769 
2018 Q1
1
4 385 
7
5 152 
2017 Q4
6
3 142 
8
4 676 
2017 Q3
3
4 158 
8
5 090 
2017 Q2
0
--- 
4
5 148 
2017 Q1
1
5 309 
5
4 535 
2016 Q4
6
5 818 
12
4 598 
2016 Q3
1
12 500 
5
5 881 
2016 Q2
2
6 485 
7
3 122 
2016 Q1
1
8 140 
6
4 650 
2015 Q4
4
4 610 
6
4 162 
2015 Q3
3
4 509 
5
2 959 
2015 Q2
1
2 259 
2
3 299 
2015 Q1
3
14 458 
4
2 563 
2014 Q4
3
5 155 
5
3 932 
2014 Q3
3
6 094 
6
4 162 
2014 Q2
3
5 556 
4
4 802 
2014 Q1
2
8 666 
3
3 727 

Pyrénées-Atlantiques (64)

Most expensive cities

City
name
Descending orderHouses
house
Price per m²
10 052 
7 465 
7 381 
6 416 
6 300 
6 095 
5 504 
5 458 
5 396 
City
name
Descending orderApartments
apt.
Price per m²
8 335 
7 541 
5 454 
5 412 
5 241 
4 973 
4 853 
4 674 
4 591 

Least expensive cities

City
name
Ascending orderHouses
house
Price per m²
512 
535 
656 
753 
764 
792 
824 
City
name
Ascending orderApartments
apt.
Price per m²
216 
228 
240 
333 
355