emooki
HomePrice mapTransactions
🇬🇧 English🇫🇷 Français🇩🇪 Deutsch🇪🇸 Español🇮🇹 Italiano

Real estate price map


Real estate price map in the municipality of Ossès, choose a section to see transactions by parcel.

Pyrénées-Atlantiques (64)
Ossès

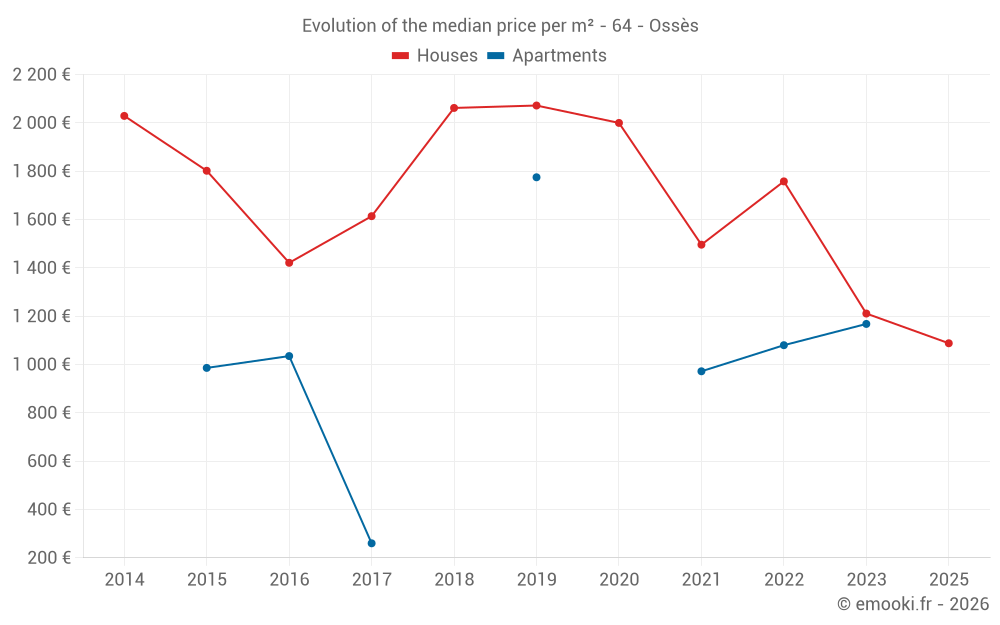
Median price of real estate
in the municipality of Ossès

HousesHouses
1 327  /m²
1-23-45-67-89-10
Reliability 4/10
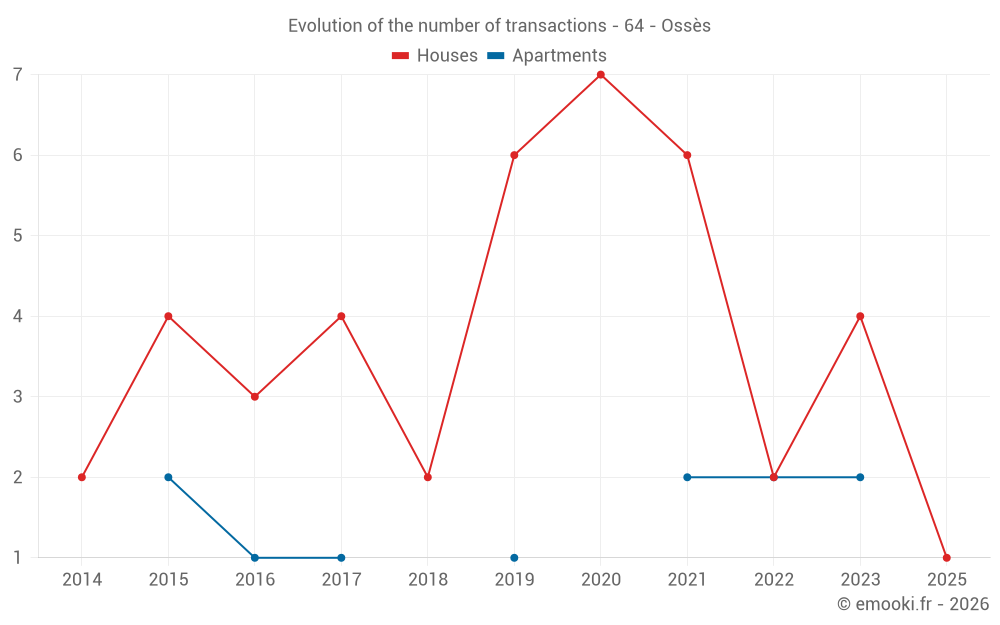
Median price on the 18 transactions of the last 60 months.
from 1 070 to
1 903  /m²
60% of transactions from the 2nd to the 8th deciles.
ApartmentsApartments
1 016  /m²
1-23-45-67-89-10
Reliability 3/10
Median price on the 7 transactions of the last 72 months.
DwellingsDwellings
1 172  /m²
1-23-45-67-89-10
Reliability 5/10
Median price on the 13 transactions of the last 48 months.
from 894 to
1 535  /m²
60% of transactions from the 2nd to the 8th deciles.

Yearly evolution

Evolution of the median price per m²

Evolution of the number of transactions

Warning, last year incomplete.

Yearly data

Descending order
Year
Houses
house
transactions
Houses
house
Price per m²
Apartments
apt.
transactions
Apartments
apt.
Price per m²
2025
1
1 088 
0
--- 
2024
0
--- 
0
--- 
2023
4
1 211 
2
1 168 
2022
2
1 758 
2
1 080 
2021
6
1 496 
2
972 
2020
7
2 000 
0
--- 
2019
6
2 072 
1
1 775 
2018
2
2 062 
0
--- 
2017
4
1 614 
1
260 
2016
3
1 421 
1
1 035 
2015
4
1 802 
2
986 
2014
2
2 029 
0
--- 

Analysis

Structure of prices per m²

Values of price percentiles per m² over the periods used for the estimated price of each type of property.

Structure of transaction amounts

Values of transaction amounts percentiles over the periods used for the estimated price of each type of property.

Transaction amounts and prices per m² by percentile

Ascending order
Percentile
Houses
house
Price per m²
Houses
house
Transaction amount
Apartments
apt.
Price per m²
Apartments
apt.
Transaction amount
10th percentile
702 
72 100 
763 
61 600 
20th percentile
1 070 
82 800 
813 
80 000 
30th percentile
1 158 
124 K
899 
125 K
40th percentile
1 170 
158 K
963 
146 K
50th percentile
1 327 
180 K
1 016 
155 K
60th percentile
1 536 
216 K
1 264 
221 K
70th percentile
1 813 
220 K
1 453 
270 K
80th percentile
1 903 
251 K
1 526 
285 K
90th percentile
2 177 
297 K
1 640 
299 K

National and departmental comparison

Evolution of the median price per m² of houses

Evolution of the median price per m² of apartments

Quarterly evolution

Evolution of the median price per m²

Evolution of the number of transactions

Quarterly data

Descending order
Quarter
Houses
house
transactions
Houses
house
Price per m²
Apartments
apt.
transactions
Apartments
apt.
Price per m²
2025 Q2
1
1 088 
0
--- 
2023 Q4
1
1 172 
0
--- 
2023 Q3
2
1 381 
1
1 550 
2023 Q2
1
1 161 
0
--- 
2023 Q1
0
--- 
1
785 
2022 Q3
2
1 758 
1
1 429 
2022 Q2
0
--- 
1
731 
2021 Q4
1
778 
0
--- 
2021 Q3
1
1 058 
0
--- 
2021 Q2
4
1 874 
1
927 
2021 Q1
0
--- 
1
1 016 
2020 Q4
4
1 702 
0
--- 
2020 Q3
1
487 
0
--- 
2020 Q1
2
2 557 
0
--- 
2019 Q4
5
1 955 
1
1 775 
2019 Q3
1
2 630 
0
--- 
2018 Q4
1
1 420 
0
--- 
2018 Q2
1
2 705 
0
--- 
2017 Q4
2
1 900 
1
260 
2017 Q2
1
1 701 
0
--- 
2017 Q1
1
1 084 
0
--- 
2016 Q4
1
1 304 
1
1 035 
2016 Q3
2
1 644 
0
--- 
2015 Q3
1
1 612 
1
929 
2015 Q2
1
2 090 
1
1 042 
2015 Q1
2
1 616 
0
--- 
2014 Q1
2
2 029 
0
--- 

Overview of the latest real estate transactions

The following list is an anonymized overview of the latest transactions. For more details and to find all transactions, please use the map to view transactions by plot or the transaction search page for a search by criteria.

2025-05-24
909 
Sale
Land
765 m2
-Jardins
/Jardin potager
Land
750 m2
-Prés
2025-04-01
87 000 
1 088  /m²(80 m²)
Sale
Houses
House
3 rooms
80 m2
Land
455 m2
-Sols
Land
220 m2
-Prés
Land
170 m2
-Prés
2024-11-23
70 000 
162  /m²(431 m²)
Sale
Commercial property
431 m2
Land
420 m2
-Sols
2024-11-18
50 043 
Sale
Land
746 m2
-Terrains à bâtir
2024-10-24
500 
Exchange
Land
299 m2
-Jardins
/Jardin potager
Land
80 m2
-Landes
/Fougeraie
Land
301 m2
-Prés
2024-10-24
45 000 
Sale
Land
341 m2
-Sols
2024-07-17
5 100 
Exchange
Land
387 m2
-Bois
Land
6390 m2
-Bois
Land
116 m2
-Bois
Land
3365 m2
-Bois
2024-07-17
37 908 
Sale
Land
631 m2
-Terres
Land
1747 m2
-Terres
2024-06-19
109 000 
Sale
Land
1875 m2
-Terrains à bâtir
2024-05-13
500 
Exchange
Land
96 m2
-Terres
Land
125 m2
-Terres
Land
206 m2
-Terres
2024-04-05
129 
Sale
Land
857 m2
-Sols
2024-03-18
3 000 
Sale
Land
26465 m2
-Landes
/Fougeraie
Land
2905 m2
-Prés
2023-12-11
62 000 
Sale
Land
172 m2
-Sols
Land
525 m2
-Terrains à bâtir
Land
1546 m2
-Prés
Land
8 m2
-Prés
Land
175 m2
-Terrains à bâtir
Land
1810 m2
-Prés
2023-11-24
9 
Sale
Land
59 m2
-Sols
2023-10-12
101 500 
326  /m²(311 m²)
1 167  /m²(87 m²)
Sale
Houses
House
4 rooms
87 m2
Commercial property
79 m2
Commercial property
145 m2
Land
225 m2
-Sols
Land
575 m2
-Prés
2023-10-09
170 000 
1 172  /m²(145 m²)
Sale
Houses
House
5 rooms
145 m2
Land
590 m2
-Sols
2023-09-29
30 000 
556  /m²(54 m²)
Sale
Commercial property
54 m2
Land
142 m2
-Sols
2023-09-13
106 400 
Sale
Land
1 m2
-Terres
Land
29 m2
-Sols
Land
1 m2
-Sols
Land
715 m2
-Terrains d'agrément
Land
100 m2
-Terrains d'agrément
2023-08-11
155 000 
1 550  /m²(100 m²)
Sale
Apartments
Apartment
5 rooms
100 m2
2 outbuildings
2023-08-10
1 
Sale
Land
5 m2
-Sols
147 transactions listed in the municipality

Pyrénées-Atlantiques (64)

Most expensive cities

City
name
Descending orderHouses
house
Price per m²
10 052 
7 465 
7 381 
6 416 
6 300 
6 095 
5 504 
5 458 
5 396 
City
name
Descending orderApartments
apt.
Price per m²
8 335 
7 541 
5 454 
5 412 
5 241 
4 973 
4 853 
4 674 
4 591 

Least expensive cities

City
name
Ascending orderHouses
house
Price per m²
512 
535 
656 
753 
764 
792 
824 
City
name
Ascending orderApartments
apt.
Price per m²
216 
228 
240 
333 
355