Median price of real estate
in the municipality of Saint-Pé-de-Léren
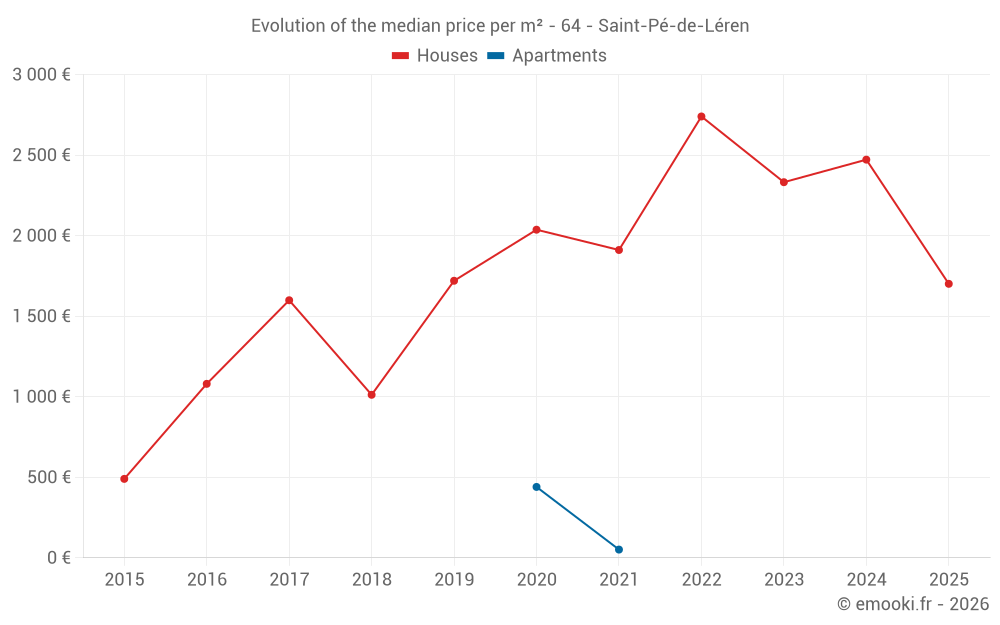
Houses
2 567 € /m²
Reliability 6/10
Median price on the 13 transactions of the last 36 months.
from 1 816 to
2 969 € /m²
2 969 € /m²
60% of transactions from the 2nd to the 8th deciles.
Apartments
246 € /m²
Reliability 1/10
Median price on the 2 transactions of the last 120 months.
Dwellings
2 567 € /m²
Reliability 6/10
Median price on the 13 transactions of the last 36 months.
from 1 816 to
2 969 € /m²
2 969 € /m²
60% of transactions from the 2nd to the 8th deciles.