emooki
HomePrice mapTransactions
🇬🇧 English🇫🇷 Français🇩🇪 Deutsch🇪🇸 Español🇮🇹 Italiano

Real estate price map


Real estate price map in the municipality of Bizanos, choose a section to see transactions by parcel.

Pyrénées-Atlantiques (64)

Bizanos - Real estate price m²

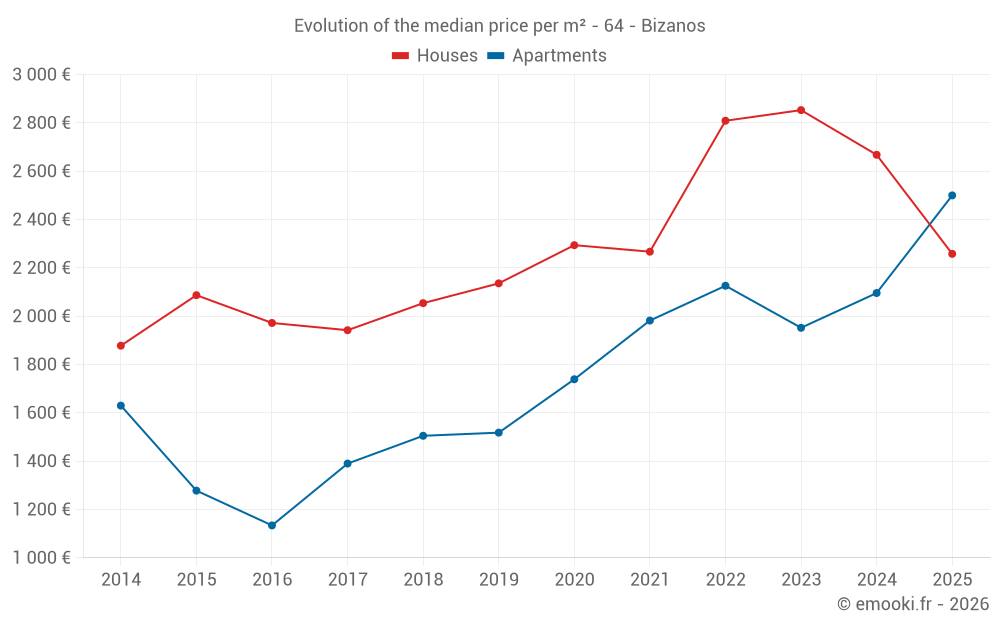
Median price of real estate
in the municipality of Bizanos

HousesHouses
2 648  /m²
1-23-45-67-89-10
Reliability 8/10
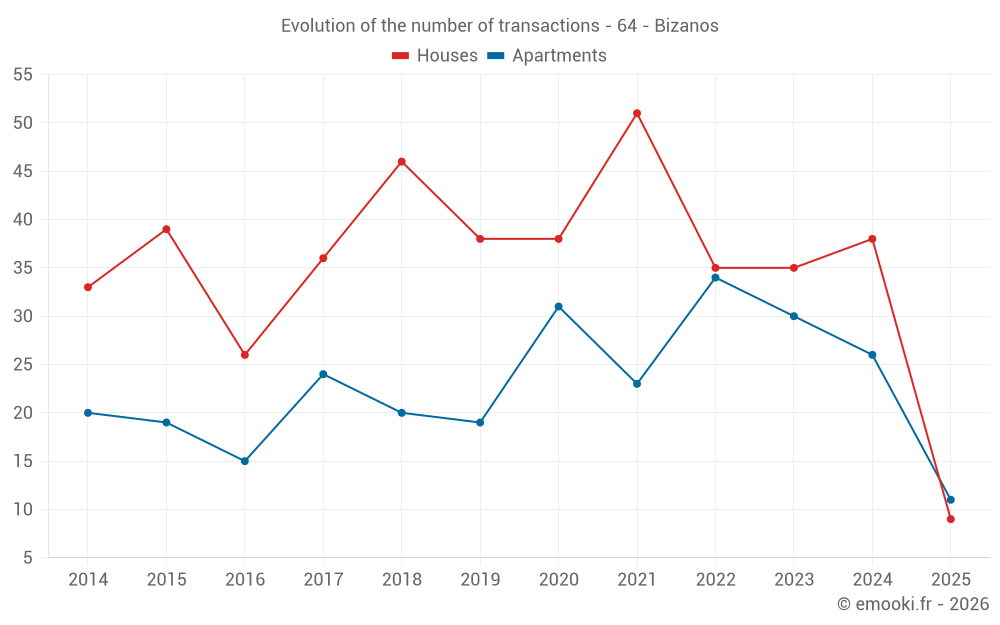
Median price on the 31 transactions of the last 12 months.
from 2 145 to
2 831  /m²
60% of transactions from the 2nd to the 8th deciles.
ApartmentsApartments
2 310  /m²
1-23-45-67-89-10
Reliability 8/10
Median price on the 27 transactions of the last 12 months.
from 1 653 to
2 623  /m²
60% of transactions from the 2nd to the 8th deciles.
DwellingsDwellings
2 472  /m²
1-23-45-67-89-10
Reliability 9/10
Median price on the 20 transactions of the last 6 months.
from 1 948 to
2 720  /m²
60% of transactions from the 2nd to the 8th deciles.
HousesEvolution of the price per m² of houses since...
1 year
-15%
2 years
-21%
3 years
-20%
4 years
-0.4%
5 years
-1.6%
6 years
+5.7%
7 years
+10%
8 years
+16%
9 years
+15%
10 years
+8.2%
11 years
+20%
The price per m² of houses has decreased by 21% since 2 years, but it has increased by 20% in 11 years.
ApartmentsEvolution of the price per m² of apartments since...
1 year
+19%
2 years
+28%
3 years
+18%
4 years
+26%
5 years
+44%
6 years
+65%
7 years
+66%
8 years
+80%
9 years
+120%
10 years
+96%
11 years
+53%

Yearly evolution

Evolution of the median price per m²

Evolution of the median price per m² - 64 - Bizanos

Evolution of the number of transactions

Warning, last year incomplete. Projections made based on the proportions between semesters of the previous year at the departmental/national level and by type of property.

Evolution of the number of transactions - 64 - Bizanos

Yearly data

Descending order
Year
Houses
house
transactions
Houses
house
Price per m²
Apartments
apt.
transactions
Apartments
apt.
Price per m²
2025
9
2 258 
11
2 500 
2024
38
2 668 
26
2 096 
2023
35
2 853 
30
1 952 
2022
35
2 809 
34
2 126 
2021
51
2 267 
23
1 982 
2020
38
2 294 
31
1 739 
2019
38
2 136 
19
1 518 
2018
46
2 054 
20
1 505 
2017
36
1 942 
24
1 390 
2016
26
1 972 
15
1 134 
2015
39
2 087 
19
1 278 
2014
33
1 878 
20
1 630 

Analysis

Structure of prices per m²

Values of price percentiles per m² over the periods used for the estimated price of each type of property.

Structure of transaction amounts

Values of transaction amounts percentiles over the periods used for the estimated price of each type of property.

Transaction amounts and prices per m² by percentile

Ascending order
Percentile
Houses
house
Price per m²
Houses
house
Transaction amount
Apartments
apt.
Price per m²
Apartments
apt.
Transaction amount
10th percentile
1 785 
168 K
1 502 
65 000 
20th percentile
2 145 
200 K
1 653 
95 600 
30th percentile
2 222 
240 K
1 753 
113 K
40th percentile
2 480 
246 K
2 195 
119 K
50th percentile
2 648 
263 K
2 310 
120 K
60th percentile
2 706 
339 K
2 420 
142 K
70th percentile
2 799 
384 K
2 553 
151 K
80th percentile
2 831 
399 K
2 623 
161 K
90th percentile
3 373 
428 K
2 700 
182 K

National and departmental comparison

Evolution of the median price per m² of houses

Evolution of the median price per m² of apartments

Quarterly evolution

Evolution of the median price per m²

Evolution of the number of transactions

Quarterly data

Descending order
Quarter
Houses
house
transactions
Houses
house
Price per m²
Apartments
apt.
transactions
Apartments
apt.
Price per m²
2025 Q2
2
2 566 
5
2 500 
2025 Q1
7
2 258 
6
2 397 
2024 Q4
9
2 789 
7
2 088 
2024 Q3
13
2 525 
9
2 290 
2024 Q2
10
2 701 
7
2 105 
2024 Q1
6
2 449 
3
1 887 
2023 Q4
8
3 604 
5
1 895 
2023 Q3
9
2 878 
9
2 041 
2023 Q2
7
2 386 
10
1 952 
2023 Q1
11
2 692 
6
2 108 
2022 Q4
7
3 214 
11
2 146 
2022 Q3
14
2 842 
7
1 905 
2022 Q2
9
2 405 
8
2 043 
2022 Q1
5
2 340 
8
2 264 
2021 Q4
9
1 994 
9
2 167 
2021 Q3
21
2 441 
4
2 178 
2021 Q2
13
2 279 
5
1 491 
2021 Q1
8
2 189 
5
1 382 
2020 Q4
9
2 027 
12
1 468 
2020 Q3
9
2 208 
8
1 919 
2020 Q2
9
2 296 
8
1 554 
2020 Q1
11
2 472 
3
1 787 
2019 Q4
12
2 128 
5
1 852 
2019 Q3
8
2 160 
5
1 409 
2019 Q2
11
2 030 
1
2 000 
2019 Q1
7
2 348 
8
1 254 
2018 Q4
10
2 232 
5
1 964 
2018 Q3
16
1 890 
5
1 412 
2018 Q2
11
2 083 
8
1 452 
2018 Q1
9
1 958 
2
1 710 
2017 Q4
8
2 194 
5
1 053 
2017 Q3
8
2 273 
4
1 755 
2017 Q2
10
1 558 
8
1 298 
2017 Q1
10
1 902 
7
2 045 
2016 Q4
3
2 146 
5
1 134 
2016 Q3
8
2 173 
1
1 154 
2016 Q2
8
1 925 
7
818 
2016 Q1
7
1 842 
2
1 458 
2015 Q4
10
2 218 
7
1 174 
2015 Q3
12
1 962 
3
606 
2015 Q2
4
1 876 
4
1 392 
2015 Q1
13
2 108 
5
1 499 
2014 Q4
8
1 650 
3
1 587 
2014 Q3
12
1 966 
6
2 182 
2014 Q2
4
1 719 
6
1 144 
2014 Q1
9
1 930 
5
1 476 

Overview of the latest real estate transactions

The following list is an anonymized overview of the latest transactions. For more details and to find all transactions, please use the map to view transactions by plot or the transaction search page for a search by criteria.

2025-06-13
110 000 
2 444  /m²(45 m²)
Sale
Apartments
Apartment
2 rooms
45 m2
2 outbuildings
2025-05-19
330 000 
1 435  /m²(230 m²)
Sale
Commercial property
16 m2
Commercial property
38 m2
Commercial property
76 m2
Commercial property
38 m2
Commercial property
48 m2
Commercial property
14 m2
Land
493 m2
-Sols
Land
307 m2
-Terres
2025-05-15
385 000 
3 348  /m²(115 m²)
Sale
Houses
House
5 rooms
115 m2
Land
733 m2
-Sols
2025-04-30
150 000 
2 500  /m²(60 m²)
Sale
Apartments
Apartment
3 rooms
60 m2
2 outbuildings
2025-04-28
145 000 
2 544  /m²(57 m²)
Sale
Apartments
Apartment
3 rooms
57 m2
2 outbuildings
2025-04-25
65 000 
Sale
Land
888 m2
-Terres
1 outbuilding
Land
66 m2
-Sols
2025-04-25
322 100 
1 342  /m²(240 m²)
Sale
Commercial property
240 m2
2025-04-15
115 000 
2 614  /m²(44 m²)
Sale
Apartments
Apartment
2 rooms
44 m2
2 outbuildings
2025-04-14
196 400 
1 785  /m²(110 m²)
Sale
Houses
House
3 rooms
110 m2
Land
150 m2
-Sols
2025-04-10
38 000 
2 235  /m²(17 m²)
Sale
Apartments
Apartment
1 room
17 m2
2025-03-31
30 000 
Sale
2 outbuildings
2025-03-13
262 500 
2 706  /m²(97 m²)
Sale
Houses
House
4 rooms
97 m2
Land
674 m2
-Sols
Land
7 m2
-Sols
Land
3 m2
-Sols
2025-03-13
270 000 
3 462  /m²(78 m²)
Sale
Houses
House
4 rooms
78 m2
Land
385 m2
-Sols
2025-03-13
141 000 
1 763  /m²(80 m²)
Sale
Apartments
Apartment
4 rooms
80 m2
1 outbuilding
2025-03-11
162 650 
2 169  /m²(75 m²)
Sale
Apartments
Apartment
2 rooms
75 m2
2025-03-03
339 000 
2 648  /m²(128 m²)
Sale
Houses
House
5 rooms
128 m2
1 outbuilding
Land
750 m2
-Sols
2025-02-28
180 500 
2 777  /m²(65 m²)
Sale
Apartments
Apartment
3 rooms
65 m2
3 outbuildings
2025-02-27
167 100 
2 258  /m²(74 m²)
Sale
Houses
House
3 rooms
74 m2
Land
135 m2
-Sols
2025-01-27
350 000 
1 989  /m²(176 m²)
Sale
Houses
House
6 rooms
176 m2
Land
916 m2
-Sols
2025-01-24
167 500 
1 269  /m²(132 m²)
Sale
Houses
House
3 rooms
66 m2
Houses
House
3 rooms
66 m2
Land
319 m2
-Sols
916 transactions listed in the municipality

Pyrénées-Atlantiques (64)

Most expensive cities

City
name
Descending orderHouses
house
Price per m²
10 052 
7 465 
7 381 
6 416 
6 300 
6 095 
5 504 
5 458 
5 396 
City
name
Descending orderApartments
apt.
Price per m²
8 335 
7 541 
5 454 
5 412 
5 241 
4 973 
4 853 
4 674 
4 591 

Least expensive cities

City
name
Ascending orderHouses
house
Price per m²
512 
535 
656 
753 
764 
792 
824 
City
name
Ascending orderApartments
apt.
Price per m²
216 
228 
240 
333 
355