emooki
HomePrice mapTransactions
🇬🇧 English🇫🇷 Français🇩🇪 Deutsch🇪🇸 Español🇮🇹 Italiano

Real estate price map


Real estate price map in the municipality of Eaux-Bonnes, choose a section to see transactions by parcel.

Pyrénées-Atlantiques (64)

Eaux-Bonnes - Real estate price m²

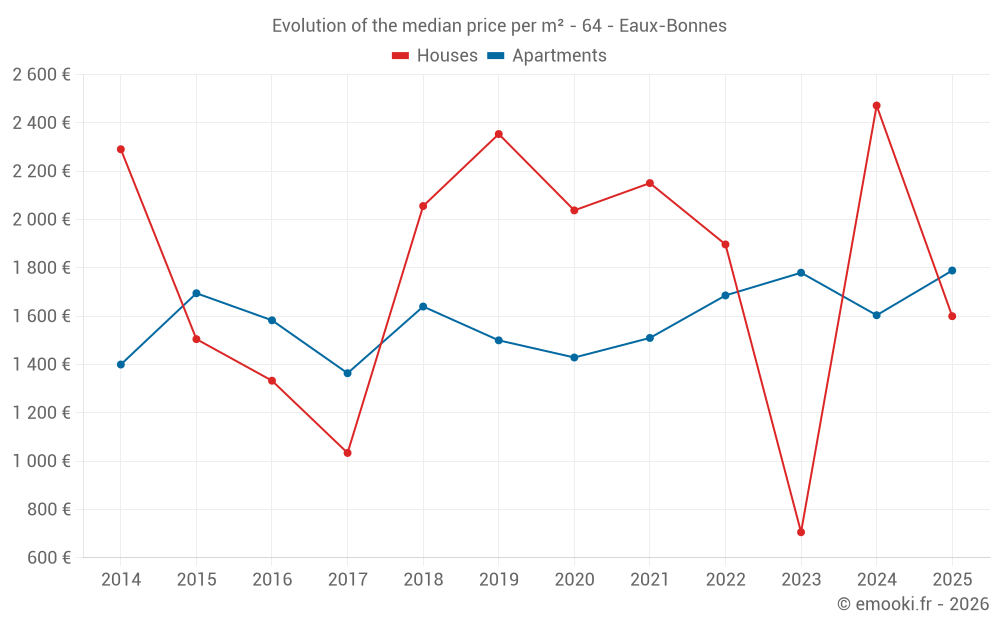
Median price of real estate
in the municipality of Eaux-Bonnes

HousesHouses
1 824  /m²
1-23-45-67-89-10
Reliability 6/10
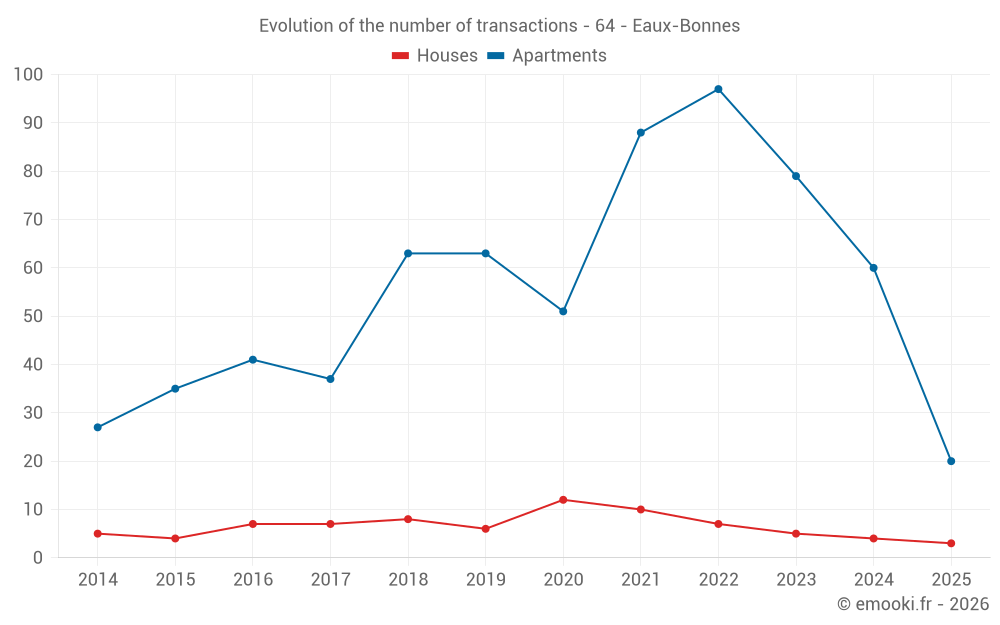
Median price on the 16 transactions of the last 36 months.
from 352 to
3 224  /m²
60% of transactions from the 2nd to the 8th deciles.
ApartmentsApartments
1 789  /m²
1-23-45-67-89-10
Reliability 9/10
Median price on the 20 transactions of the last 6 months.
from 1 240 to
2 134  /m²
60% of transactions from the 2nd to the 8th deciles.
DwellingsDwellings
1 724  /m²
1-23-45-67-89-10
Reliability 9/10
Median price on the 23 transactions of the last 6 months.
from 1 220 to
2 100  /m²
60% of transactions from the 2nd to the 8th deciles.
ApartmentsEvolution of the price per m² of apartments since...
1 year
+12%
2 years
+0.5%
3 years
+6.1%
4 years
+18%
5 years
+25%
6 years
+19%
7 years
+9.1%
8 years
+31%
9 years
+13%
10 years
+5.5%
11 years
+28%

Yearly evolution

Evolution of the median price per m²

Evolution of the median price per m² - 64 - Eaux-Bonnes

Evolution of the number of transactions

Warning, last year incomplete. Projections made based on the proportions between semesters of the previous year at the departmental/national level and by type of property.

Evolution of the number of transactions - 64 - Eaux-Bonnes

Yearly data

Descending order
Year
Houses
house
transactions
Houses
house
Price per m²
Apartments
apt.
transactions
Apartments
apt.
Price per m²
2025
3
1 600 
20
1 789 
2024
4
2 472 
60
1 604 
2023
5
706 
79
1 780 
2022
7
1 897 
97
1 686 
2021
10
2 151 
88
1 510 
2020
12
2 038 
51
1 429 
2019
6
2 354 
63
1 500 
2018
8
2 056 
63
1 640 
2017
7
1 034 
37
1 364 
2016
7
1 333 
41
1 583 
2015
4
1 505 
35
1 695 
2014
5
2 291 
27
1 400 

Analysis

Structure of prices per m²

Values of price percentiles per m² over the periods used for the estimated price of each type of property.

Structure of transaction amounts

Values of transaction amounts percentiles over the periods used for the estimated price of each type of property.

Transaction amounts and prices per m² by percentile

Ascending order
Percentile
Houses
house
Price per m²
Houses
house
Transaction amount
Apartments
apt.
Price per m²
Apartments
apt.
Transaction amount
10th percentile
245 
36 408 
1 118 
33 551 
20th percentile
352 
96 600 
1 240 
38 040 
30th percentile
693 
130 K
1 305 
42 930 
40th percentile
1 154 
150 K
1 408 
46 800 
50th percentile
1 824 
170 K
1 789 
49 700 
60th percentile
2 077 
173 K
1 914 
50 760 
70th percentile
2 890 
210 K
2 007 
56 234 
80th percentile
3 224 
236 K
2 134 
65 360 
90th percentile
4 294 
258 K
2 405 
75 050 

National and departmental comparison

Evolution of the median price per m² of houses

Evolution of the median price per m² of apartments

Quarterly evolution

Evolution of the median price per m²

Evolution of the number of transactions

Quarterly data

Descending order
Quarter
Houses
house
transactions
Houses
house
Price per m²
Apartments
apt.
transactions
Apartments
apt.
Price per m²
2025 Q2
2
1 602 
12
1 800 
2025 Q1
1
1 600 
8
1 632 
2024 Q4
1
7 857 
16
1 618 
2024 Q3
1
2 866 
17
1 629 
2024 Q2
1
680 
16
1 521 
2024 Q1
1
2 077 
11
1 433 
2023 Q4
1
706 
27
1 615 
2023 Q3
2
4 116 
13
2 057 
2023 Q2
2
274 
22
1 686 
2023 Q1
0
--- 
17
1 943 
2022 Q4
1
250 
33
1 782 
2022 Q3
3
2 913 
23
1 759 
2022 Q2
1
1 350 
24
1 611 
2022 Q1
2
2 485 
17
1 458 
2021 Q4
2
2 769 
25
1 579 
2021 Q3
3
1 867 
24
1 611 
2021 Q2
2
5 106 
20
1 325 
2021 Q1
3
426 
19
1 304 
2020 Q4
7
1 719 
17
1 444 
2020 Q3
1
771 
12
1 611 
2020 Q2
3
2 472 
15
1 100 
2020 Q1
1
2 113 
7
1 818 
2019 Q4
0
--- 
18
1 546 
2019 Q3
4
1 807 
19
1 500 
2019 Q2
1
2 986 
15
1 353 
2019 Q1
1
2 595 
11
1 464 
2018 Q4
4
2 110 
24
1 691 
2018 Q3
1
1 957 
13
1 792 
2018 Q2
2
2 982 
15
1 406 
2018 Q1
1
2 155 
11
1 796 
2017 Q4
3
875 
6
1 636 
2017 Q3
1
1 723 
12
1 168 
2017 Q2
1
382 
6
1 644 
2017 Q1
2
2 080 
13
1 333 
2016 Q4
2
1 418 
14
1 723 
2016 Q3
2
979 
10
1 924 
2016 Q2
3
688 
10
1 660 
2016 Q1
0
--- 
7
1 074 
2015 Q4
1
1 481 
10
1 461 
2015 Q3
1
1 529 
8
1 829 
2015 Q2
1
1 667 
7
1 871 
2015 Q1
1
443 
10
1 424 
2014 Q4
0
--- 
8
1 170 
2014 Q3
3
2 291 
8
1 724 
2014 Q2
2
1 988 
6
1 724 
2014 Q1
0
--- 
5
1 636 

Overview of the latest real estate transactions

The following list is an anonymized overview of the latest transactions. For more details and to find all transactions, please use the map to view transactions by plot or the transaction search page for a search by criteria.

2025-06-30
45 000 
1 406  /m²(32 m²)
Sale
Apartments
Apartment
2 rooms
32 m2
3 outbuildings
2025-06-17
70 000 
2 414  /m²(29 m²)
Sale
Apartments
Apartment
2 rooms
29 m2
2025-05-23
84 155 
2 404  /m²(35 m²)
Sale
Apartments
Apartment
1 room
35 m2
1 outbuilding
2025-05-14
49 400 
1 976  /m²(25 m²)
Sale
Apartments
Apartment
1 room
25 m2
1 outbuilding
2025-05-12
75 000 
1 875  /m²(40 m²)
Sale
Apartments
Apartment
40 m2
1 outbuilding
2025-05-05
37 000 
1 321  /m²(28 m²)
Sale
Apartments
Apartment
1 room
28 m2
1 outbuilding
2025-04-28
16 500 
550  /m²(30 m²)
Sale
Apartments
Apartment
1 room
30 m2
4 outbuildings
2025-04-25
48 000 
1 200  /m²(40 m²)
Sale
Apartments
Apartment
2 rooms
40 m2
1 outbuilding
2025-04-25
50 000 
1 724  /m²(29 m²)
Sale
Apartments
Apartment
2 rooms
29 m2
2025-04-23
39 500 
2 079  /m²(19 m²)
Sale
Land
100 m2
-Sols
Apartments
Apartment
1 room
19 m2
2025-04-14
150 000 
1 154  /m²(130 m²)
Sale
Houses
House
3 rooms
130 m2
1 outbuilding
Land
120 m2
-Sols
Land
4470 m2
-Futaies feuillues
/CHENE
Land
7980 m2
-Prés
2025-04-10
245 877 
2 049  /m²(120 m²)
Sale
Houses
House
3 rooms
120 m2
Land
228 m2
-Sols
2025-04-09
38 300 
1 126  /m²(34 m²)
Sale
Apartments
Apartment
1 room
34 m2
1 outbuilding
2025-04-02
57 200 
1 972  /m²(29 m²)
Sale
Apartments
Apartment
2 rooms
29 m2
2025-03-25
33 810 
1 409  /m²(24 m²)
Sale
Apartments
Apartment
1 room
24 m2
1 outbuilding
2025-03-21
75 500 
2 517  /m²(30 m²)
Sale
Apartments
Apartment
1 room
30 m2
1 outbuilding
2025-03-18
51 900 
1 854  /m²(28 m²)
Sale
Apartments
Apartment
1 room
28 m2
1 outbuilding
2025-03-14
16 000 
Sale
1 outbuilding
Land
206 m2
-Sols
Land
497 m2
-Sols
2025-02-28
55 820 
1 269  /m²(44 m²)
Sale
Apartments
Apartment
1 room
44 m2
2025-02-12
64 200 
2 214  /m²(29 m²)
Sale
Apartments
Apartment
2 rooms
29 m2
852 transactions listed in the municipality

Pyrénées-Atlantiques (64)

Most expensive cities

City
name
Descending orderHouses
house
Price per m²
10 052 
7 465 
7 381 
6 416 
6 300 
6 095 
5 504 
5 458 
5 396 
City
name
Descending orderApartments
apt.
Price per m²
8 335 
7 541 
5 454 
5 412 
5 241 
4 973 
4 853 
4 674 
4 591 

Least expensive cities

City
name
Ascending orderHouses
house
Price per m²
512 
535 
656 
753 
764 
792 
824 
City
name
Ascending orderApartments
apt.
Price per m²
216 
228 
240 
333 
355