emooki
HomePrice mapTransactions
🇬🇧 English🇫🇷 Français🇩🇪 Deutsch🇪🇸 Español🇮🇹 Italiano

Real estate price map


Real estate price map in the municipality of Lescar, choose a section to see transactions by parcel.

Pyrénées-Atlantiques (64)

Lescar - Real estate price m²

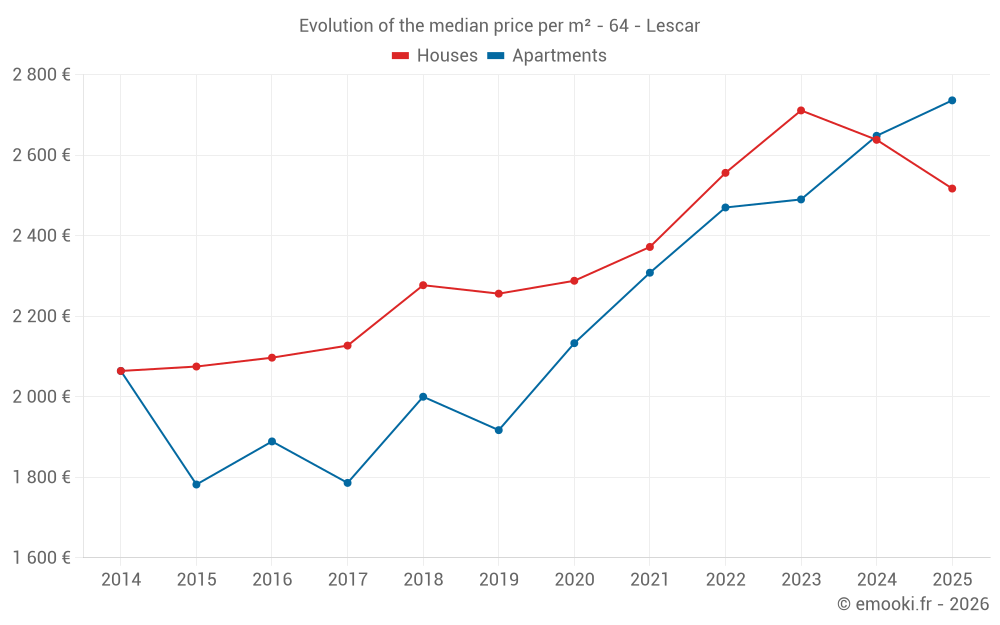
Median price of real estate
in the municipality of Lescar

HousesHouses
2 517  /m²
1-23-45-67-89-10
Reliability 9/10
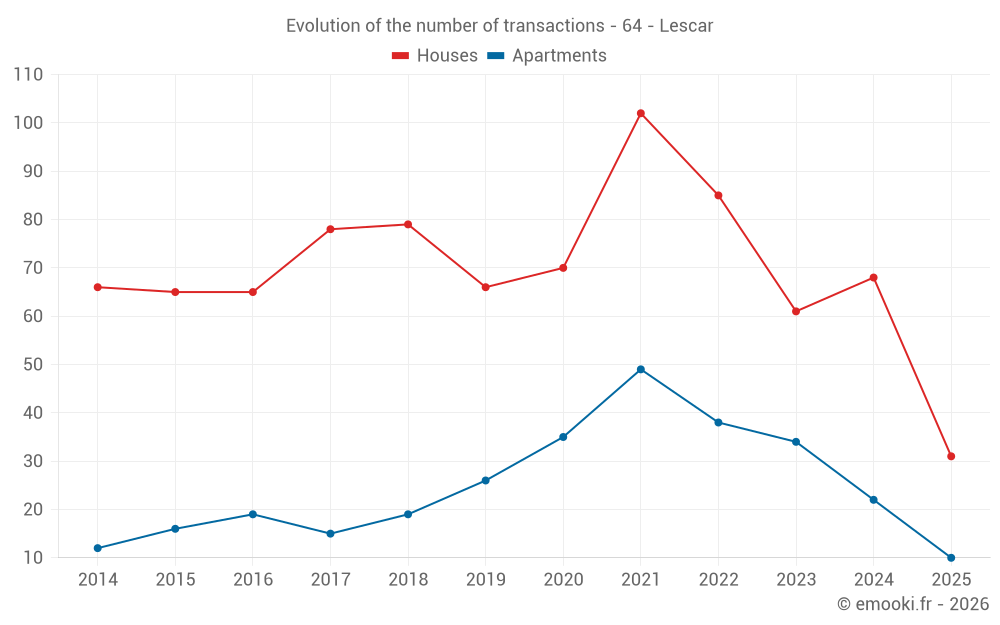
Median price on the 31 transactions of the last 6 months.
from 1 824 to
3 133  /m²
60% of transactions from the 2nd to the 8th deciles.
ApartmentsApartments
2 671  /m²
1-23-45-67-89-10
Reliability 8/10
Median price on the 22 transactions of the last 12 months.
from 2 306 to
2 971  /m²
60% of transactions from the 2nd to the 8th deciles.
DwellingsDwellings
2 560  /m²
1-23-45-67-89-10
Reliability 9/10
Median price on the 41 transactions of the last 6 months.
from 2 061 to
3 096  /m²
60% of transactions from the 2nd to the 8th deciles.
HousesEvolution of the price per m² of houses since...
1 year
-4.6%
2 years
-7.2%
3 years
-1.5%
4 years
+6.1%
5 years
+10%
6 years
+12%
7 years
+11%
8 years
+18%
9 years
+20%
10 years
+21%
11 years
+22%
The price per m² of houses has decreased by 7.2% since 2 years, but it has increased by 22% in 11 years.
ApartmentsEvolution of the price per m² of apartments since...
1 year
+3.3%
2 years
+10%
3 years
+11%
4 years
+19%
5 years
+28%
6 years
+43%
7 years
+37%
8 years
+53%
9 years
+45%
10 years
+54%
11 years
+33%

Yearly evolution

Evolution of the median price per m²

Evolution of the median price per m² - 64 - Lescar

Evolution of the number of transactions

Warning, last year incomplete. Projections made based on the proportions between semesters of the previous year at the departmental/national level and by type of property.

Evolution of the number of transactions - 64 - Lescar

Yearly data

Descending order
Year
Houses
house
transactions
Houses
house
Price per m²
Apartments
apt.
transactions
Apartments
apt.
Price per m²
2025
31
2 517 
10
2 736 
2024
68
2 638 
22
2 648 
2023
61
2 711 
34
2 490 
2022
85
2 556 
38
2 470 
2021
102
2 372 
49
2 308 
2020
70
2 288 
35
2 133 
2019
66
2 256 
26
1 917 
2018
79
2 277 
19
2 000 
2017
78
2 127 
15
1 786 
2016
65
2 097 
19
1 889 
2015
65
2 075 
16
1 782 
2014
66
2 064 
12
2 064 

Analysis

Structure of prices per m²

Values of price percentiles per m² over the periods used for the estimated price of each type of property.

Structure of transaction amounts

Values of transaction amounts percentiles over the periods used for the estimated price of each type of property.

Transaction amounts and prices per m² by percentile

Ascending order
Percentile
Houses
house
Price per m²
Houses
house
Transaction amount
Apartments
apt.
Price per m²
Apartments
apt.
Transaction amount
10th percentile
1 635 
160 K
2 200 
92 765 
20th percentile
1 824 
217 K
2 306 
104 K
30th percentile
2 134 
245 K
2 444 
110 K
40th percentile
2 389 
257 K
2 634 
114 K
50th percentile
2 517 
327 K
2 671 
123 K
60th percentile
2 569 
329 K
2 738 
136 K
70th percentile
2 867 
340 K
2 886 
147 K
80th percentile
3 133 
361 K
2 971 
189 K
90th percentile
3 717 
423 K
3 075 
199 K

National and departmental comparison

Evolution of the median price per m² of houses

Evolution of the median price per m² of apartments

Quarterly evolution

Evolution of the median price per m²

Evolution of the number of transactions

Quarterly data

Descending order
Quarter
Houses
house
transactions
Houses
house
Price per m²
Apartments
apt.
transactions
Apartments
apt.
Price per m²
2025 Q2
12
2 576 
4
2 736 
2025 Q1
19
2 134 
6
2 659 
2024 Q4
25
2 730 
8
2 576 
2024 Q3
18
2 232 
4
2 671 
2024 Q2
15
2 336 
5
2 667 
2024 Q1
10
2 884 
5
2 022 
2023 Q4
15
2 965 
9
2 546 
2023 Q3
17
2 742 
10
2 496 
2023 Q2
12
2 654 
9
2 336 
2023 Q1
17
2 535 
6
2 528 
2022 Q4
19
2 500 
12
2 516 
2022 Q3
21
2 512 
8
2 664 
2022 Q2
22
2 596 
10
2 357 
2022 Q1
23
2 444 
8
2 252 
2021 Q4
25
2 392 
9
1 970 
2021 Q3
35
2 421 
16
2 444 
2021 Q2
22
2 444 
15
2 261 
2021 Q1
20
2 180 
9
2 386 
2020 Q4
24
2 226 
18
2 146 
2020 Q3
17
2 365 
7
2 065 
2020 Q2
14
2 392 
6
2 095 
2020 Q1
15
2 233 
4
2 182 
2019 Q4
20
2 164 
6
1 820 
2019 Q3
25
2 259 
8
2 114 
2019 Q2
12
2 090 
4
1 840 
2019 Q1
9
2 355 
8
2 043 
2018 Q4
14
2 472 
5
2 026 
2018 Q3
26
2 153 
4
1 229 
2018 Q2
21
2 303 
5
2 129 
2018 Q1
18
2 294 
5
1 982 
2017 Q4
24
2 143 
5
1 676 
2017 Q3
23
2 271 
5
1 732 
2017 Q2
22
2 090 
4
2 116 
2017 Q1
9
2 013 
1
2 182 
2016 Q4
17
2 171 
5
1 524 
2016 Q3
21
2 147 
4
2 114 
2016 Q2
18
2 064 
2
2 194 
2016 Q1
9
1 933 
8
1 966 
2015 Q4
16
1 960 
8
1 484 
2015 Q3
25
2 094 
4
1 842 
2015 Q2
12
1 862 
2
1 909 
2015 Q1
12
2 165 
2
1 486 
2014 Q4
18
2 024 
2
2 118 
2014 Q3
19
2 139 
2
1 666 
2014 Q2
11
2 176 
1
2 254 
2014 Q1
18
1 965 
7
2 062 

Overview of the latest real estate transactions

The following list is an anonymized overview of the latest transactions. For more details and to find all transactions, please use the map to view transactions by plot or the transaction search page for a search by criteria.

2025-06-10
650 000 
2 569  /m²(253 m²)
Sale
Houses
House
7 rooms
253 m2
1 outbuilding
Land
954 m2
-Terrains d'agrément
Land
500 m2
-Sols
2025-05-23
88 000 
374  /m²(235 m²)
Sale
Commercial property
235 m2
Land
858 m2
-Sols
2025-05-19
535 000 
246  /m²(2175 m²)
Sale
Commercial property
2175 m2
Land
556 m2
-Sols
Land
4000 m2
-Sols
2025-05-19
550 000 
327  /m²(1682 m²)
Sale
Commercial property
1682 m2
Land
5094 m2
-Sols
2025-05-15
330 624 
2 583  /m²(128 m²)
Sale
Houses
House
6 rooms
128 m2
Land
840 m2
-Sols
Land
535 m2
-Jardins
Land
910 m2
-Sols
Land
90 m2
-Prés
2025-05-07
182 000 
Sale
Land
960 m2
-Sols
Land
1870 m2
-Sols
Land
730 m2
-Sols
Land
137 m2
-Sols
Land
4 m2
-Sols
2025-05-06
79 000 
Sale
1 outbuilding
Land
127 m2
-Sols
Land
381 m2
-Terres
2025-04-30
179 192 
2 560  /m²(70 m²)
Sale
Houses
House
3 rooms
70 m2
Land
567 m2
-Sols
2025-04-29
245 000 
2 379  /m²(103 m²)
Sale
Houses
House
3 rooms
103 m2
Land
163 m2
-Sols
2025-04-29
138 250 
3 142  /m²(44 m²)
Sale
Apartments
Apartment
2 rooms
44 m2
2 outbuildings
2025-04-29
358 700 
3 146  /m²(114 m²)
Sale
Houses
House
4 rooms
114 m2
2 outbuildings
Land
827 m2
-Sols
2025-04-28
430 000 
Sale
Commercial property
Land
2671 m2
-Sols
Land
3036 m2
-Terrains à bâtir
2025-04-25
76 000 
Sale
Land
637 m2
-Terrains d'agrément
2025-04-25
217 000 
2 494  /m²(87 m²)
Sale
Houses
House
5 rooms
87 m2
1 outbuilding
Land
775 m2
-Sols
2025-04-25
178 675 
Sale
Land
16544 m2
-Peupleraies
2025-04-25
480 000 
Sale
Land
16544 m2
-Peupleraies
2025-04-24
327 135 
3 717  /m²(88 m²)
Sale
Houses
House
4 rooms
88 m2
1 outbuilding
Land
1145 m2
-Sols
Land
741 m2
-Sols
Land
93 m2
-Sols
2025-04-23
424 858 
2 544  /m²(167 m²)
Sale
Houses
House
7 rooms
167 m2
1 outbuilding
Land
815 m2
-Sols
2025-04-22
60 000 
504  /m²(119 m²)
Sale
Land
14 m2
-Sols
Commercial property
119 m2
Land
119 m2
-Sols
2025-04-22
49 000 
55  /m²(895 m²)
Sale
Land
46 m2
-Sols
Commercial property
895 m2
Land
1085 m2
-Sols
1613 transactions listed in the municipality

Pyrénées-Atlantiques (64)

Most expensive cities

City
name
Descending orderHouses
house
Price per m²
10 052 
7 465 
7 381 
6 416 
6 300 
6 095 
5 504 
5 458 
5 396 
City
name
Descending orderApartments
apt.
Price per m²
8 335 
7 541 
5 454 
5 412 
5 241 
4 973 
4 853 
4 674 
4 591 

Least expensive cities

City
name
Ascending orderHouses
house
Price per m²
512 
535 
656 
753 
764 
792 
824 
City
name
Ascending orderApartments
apt.
Price per m²
216 
228 
240 
333 
355