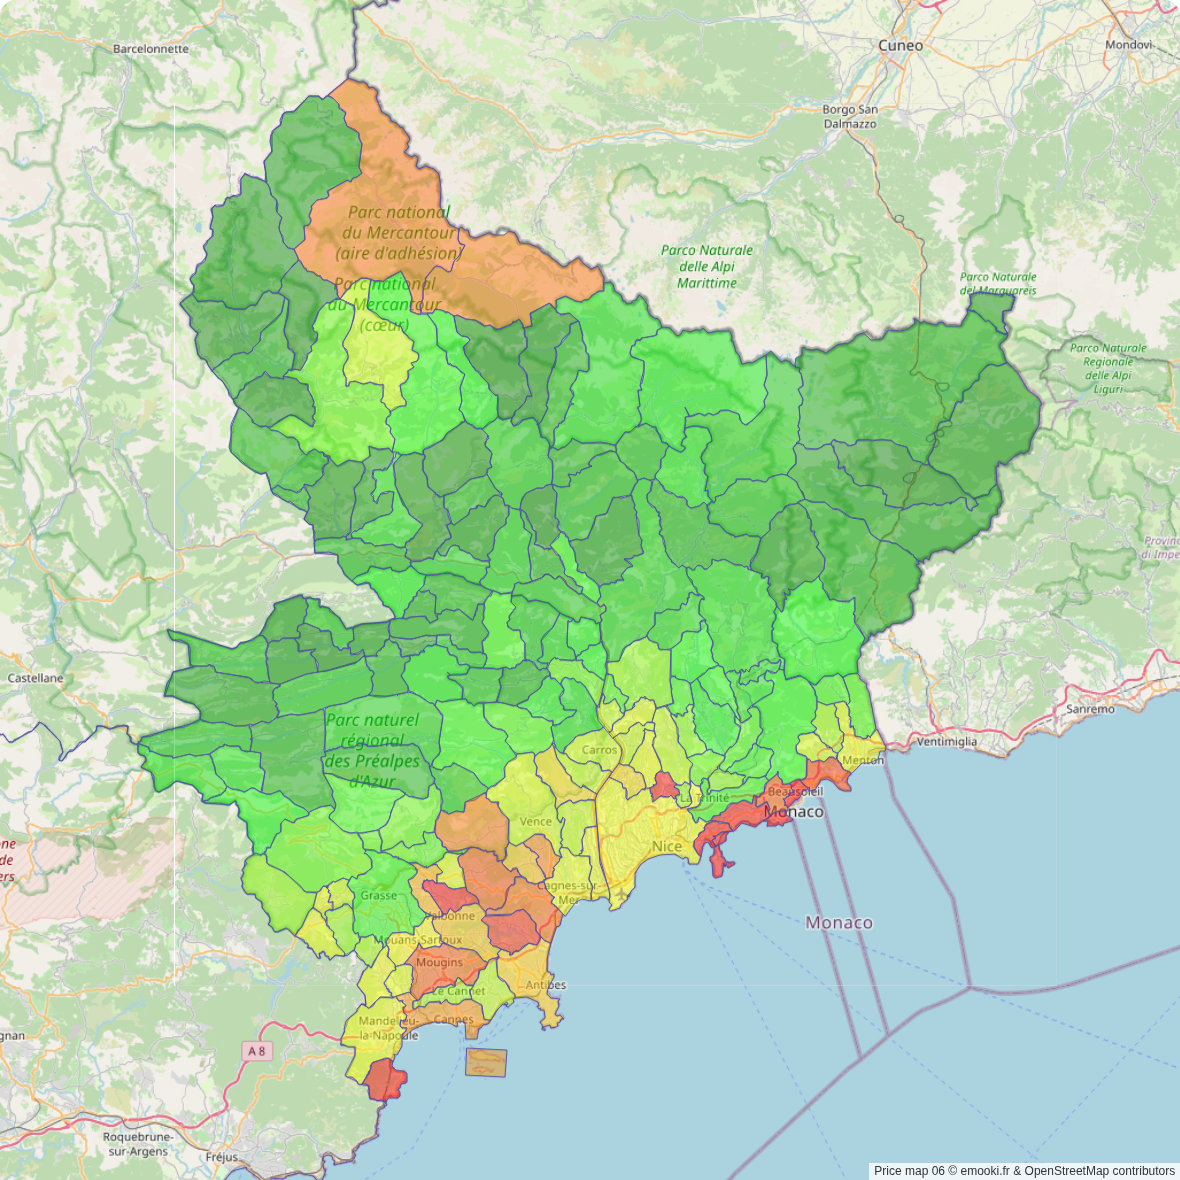
Real estate price map
Real estate price map by city in the Alpes-Maritimes department, click on a city to see prices by section. Download as image
Price m² Alpes-Maritimes
Median price of real estate
in the Alpes-Maritimes department
8 151 € /m²
6 397 € /m²
6 563 € /m²
Yearly data
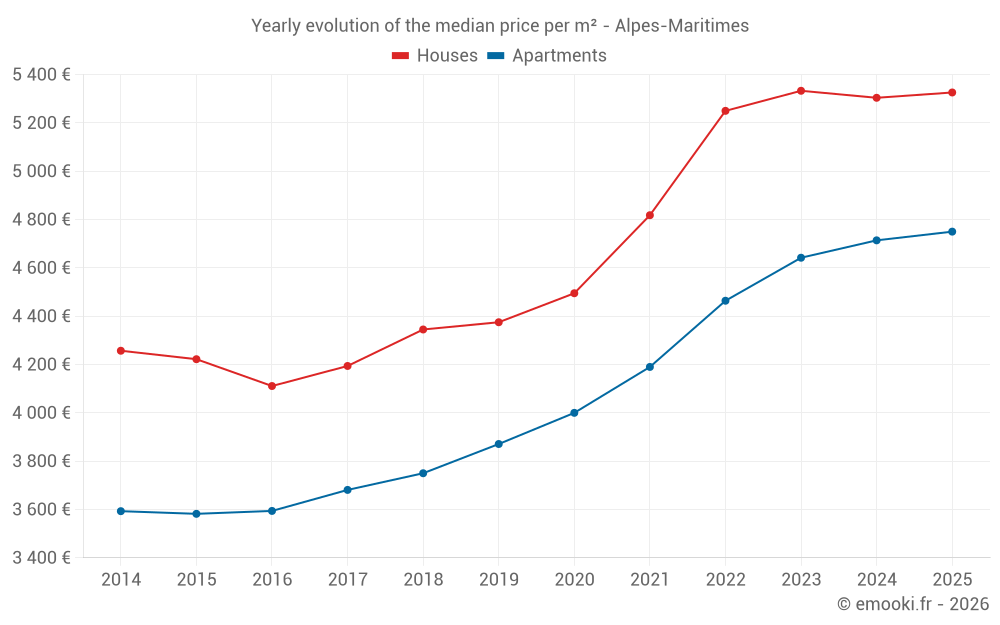
Yearly evolution of the median price per m²
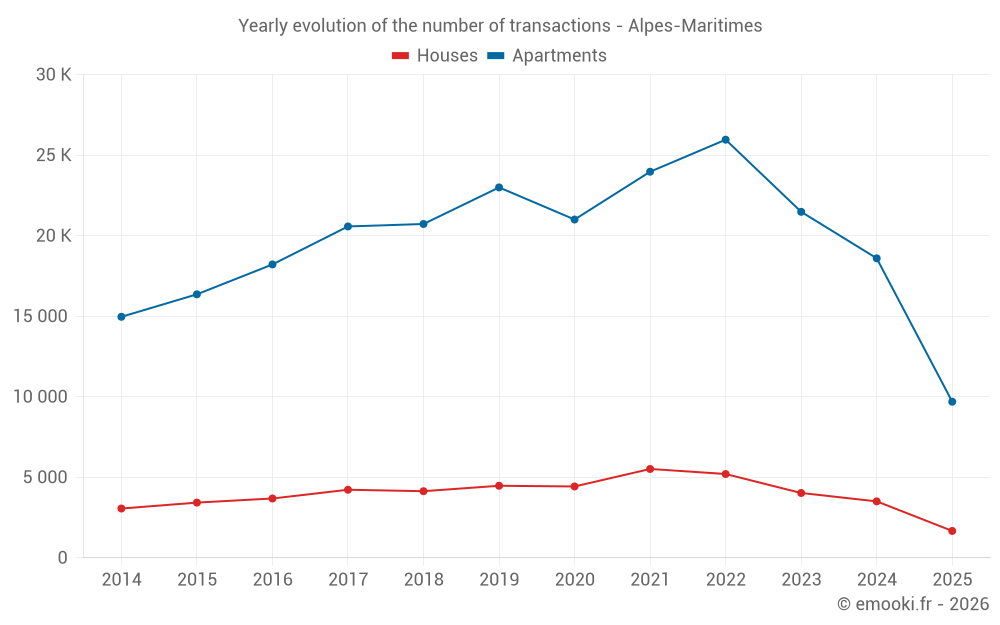
Yearly evolution of the number of transactions
Warning, last year incomplete. Projections made based on the proportions between semesters of the previous year at the departmental/national level and by type of property.
Yearly table
transactions
Price per m²
transactions
Price per m²
Analysis
Structure of prices per m²
Values of price percentiles per m² over the periods used for the estimated price of each type of property.
Structure of transaction amounts
Values of transaction amounts percentiles over the periods used for the estimated price of each type of property.
Transaction amounts and prices per m² by percentile
Price per m²
Transaction amount
Price per m²
Transaction amount
Quarterly data
Quarterly evolution of the median price per m²
Quarterly evolution of the number of transactions
Quarterly table
transactions
Price per m²
transactions
Price per m²
Key takeaways
What is the price per m2 of houses in the Alpes-Maritimes department?
The median price on the 813 house transactions of the last 3 months in the Alpes-Maritimes department was 5 353 € per square meter for a median property value of 538 000 €. Over this period, 60% of transactions were between 3 443 and 8 151 € per square meter (from the 2nd to the 8th deciles).
What is the price per m2 of apartments in the Alpes-Maritimes department?
The median price on the 4802 apartment transactions of the last 3 months in the Alpes-Maritimes department was 4 737 € per square meter for a median property value of 228 000 €. Over this period, 60% of transactions were between 3 443 and 6 397 € per square meter (from the 2nd to the 8th deciles).
All municipalities in the Alpes-Maritimes department
name
Price per m²
Price per m²