emooki
HomePrice mapTransactions
🇬🇧 English🇫🇷 Français🇩🇪 Deutsch🇪🇸 Español🇮🇹 Italiano

Real estate price map


Real estate price map in the municipality of Lantosque, choose a section to see transactions by parcel.

Alpes-Maritimes (06)

Lantosque - Real estate price m²

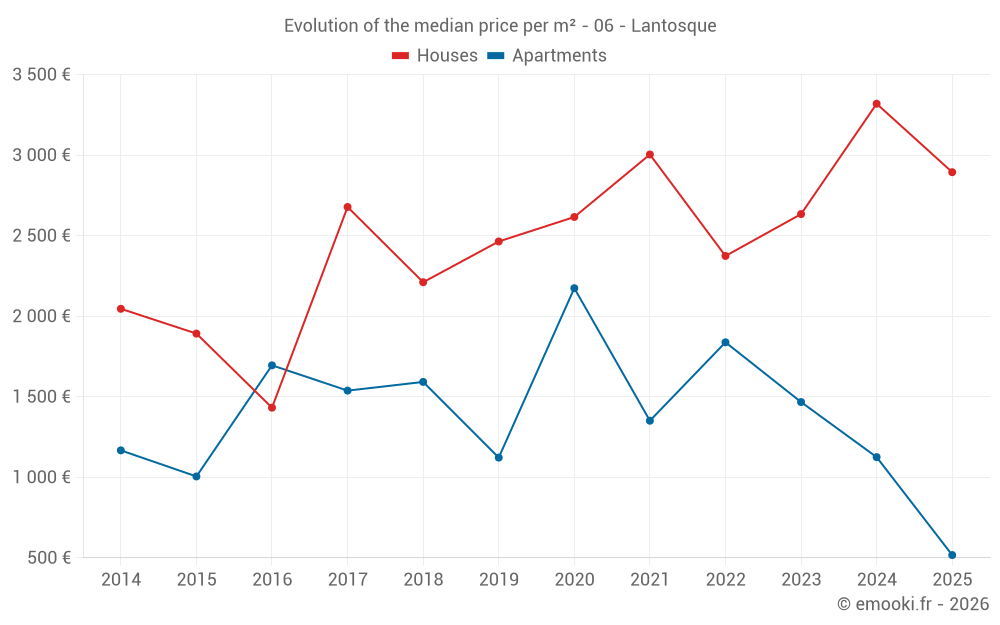
Median price of real estate
in the municipality of Lantosque

HousesHouses
3 305  /m²
1-23-45-67-89-10
Reliability 7/10
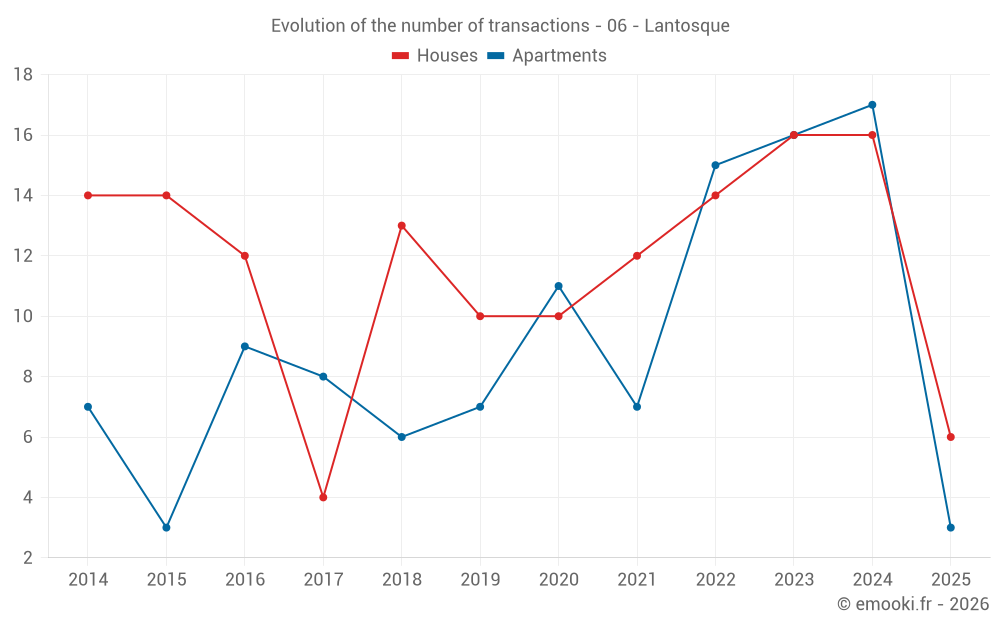
Median price on the 33 transactions of the last 24 months.
from 1 507 to
4 055  /m²
60% of transactions from the 2nd to the 8th deciles.
ApartmentsApartments
1 084  /m²
1-23-45-67-89-10
Reliability 7/10
Median price on the 24 transactions of the last 24 months.
from 594 to
2 047  /m²
60% of transactions from the 2nd to the 8th deciles.
DwellingsDwellings
1 670  /m²
1-23-45-67-89-10
Reliability 8/10
Median price on the 26 transactions of the last 12 months.
from 789 to
3 305  /m²
60% of transactions from the 2nd to the 8th deciles.
HousesEvolution of the price per m² of houses since...
1 year
-13%
2 years
+10%
3 years
+22%
4 years
-3.7%
5 years
+11%
6 years
+17%
7 years
+31%
8 years
+8.1%
9 years
+102%
10 years
+53%
11 years
+41%
The price per m² of houses has decreased by 13% since 1 year, but it has increased by 102% in 9 years.

Yearly evolution

Evolution of the median price per m²

Evolution of the median price per m² - 06 - Lantosque

Evolution of the number of transactions

Warning, last year incomplete. Projections made based on the proportions between semesters of the previous year at the departmental/national level and by type of property.

Evolution of the number of transactions - 06 - Lantosque

Yearly data

Descending order
Year
Houses
house
transactions
Houses
house
Price per m²
Apartments
apt.
transactions
Apartments
apt.
Price per m²
2025
6
2 894 
3
517 
2024
16
3 319 
17
1 125 
2023
16
2 634 
16
1 467 
2022
14
2 374 
15
1 838 
2021
12
3 004 
7
1 351 
2020
10
2 616 
11
2 174 
2019
10
2 464 
7
1 122 
2018
13
2 211 
6
1 592 
2017
4
2 678 
8
1 538 
2016
12
1 432 
9
1 695 
2015
14
1 892 
3
1 005 
2014
14
2 046 
7
1 167 

Analysis

Structure of prices per m²

Values of price percentiles per m² over the periods used for the estimated price of each type of property.

Structure of transaction amounts

Values of transaction amounts percentiles over the periods used for the estimated price of each type of property.

Transaction amounts and prices per m² by percentile

Ascending order
Percentile
Houses
house
Price per m²
Houses
house
Transaction amount
Apartments
apt.
Price per m²
Apartments
apt.
Transaction amount
10th percentile
1 106 
60 191 
404 
9 550 
20th percentile
1 507 
119 K
594 
30 000 
30th percentile
2 156 
132 K
782 
43 350 
40th percentile
2 524 
152 K
1 025 
47 600 
50th percentile
3 305 
180 K
1 084 
59 650 
60th percentile
3 488 
200 K
1 354 
66 480 
70th percentile
3 620 
227 K
1 515 
85 550 
80th percentile
4 055 
268 K
2 047 
90 800 
90th percentile
5 091 
323 K
2 394 
141 K

National and departmental comparison

Evolution of the median price per m² of houses

Evolution of the median price per m² of apartments

Quarterly evolution

Evolution of the median price per m²

Evolution of the number of transactions

Quarterly data

Descending order
Quarter
Houses
house
transactions
Houses
house
Price per m²
Apartments
apt.
transactions
Apartments
apt.
Price per m²
2025 Q2
1
2 266 
2
404 
2025 Q1
5
3 522 
1
789 
2024 Q4
5
3 030 
4
424 
2024 Q3
3
1 429 
5
1 500 
2024 Q2
4
3 500 
5
1 034 
2024 Q1
4
3 054 
3
1 654 
2023 Q4
5
2 560 
2
1 392 
2023 Q3
6
2 890 
2
1 960 
2023 Q2
2
3 257 
5
1 950 
2023 Q1
3
1 714 
7
1 140 
2022 Q4
0
--- 
5
1 838 
2022 Q3
4
1 925 
4
2 130 
2022 Q2
5
2 611 
4
1 838 
2022 Q1
5
2 427 
2
1 157 
2021 Q4
3
4 109 
1
1 607 
2021 Q3
3
2 326 
1
2 154 
2021 Q2
3
2 958 
3
512 
2021 Q1
3
3 357 
2
954 
2020 Q4
3
3 376 
2
762 
2020 Q3
2
5 400 
2
1 744 
2020 Q2
2
2 298 
1
1 345 
2020 Q1
3
2 202 
6
2 236 
2019 Q4
3
2 745 
4
1 324 
2019 Q3
3
2 478 
1
658 
2019 Q2
2
2 432 
1
1 843 
2019 Q1
2
1 584 
1
883 
2018 Q4
6
2 060 
1
2 257 
2018 Q3
3
2 554 
1
1 870 
2018 Q2
2
2 394 
2
753 
2018 Q1
2
2 218 
2
1 572 
2017 Q4
0
--- 
3
1 465 
2017 Q2
2
1 810 
4
1 624 
2017 Q1
2
3 690 
1
603 
2016 Q4
4
1 102 
2
1 002 
2016 Q3
2
2 605 
4
1 738 
2016 Q2
3
1 364 
1
1 212 
2016 Q1
3
3 488 
2
2 118 
2015 Q4
6
2 454 
0
--- 
2015 Q3
5
879 
1
1 005 
2015 Q2
1
1 351 
2
751 
2015 Q1
2
1 432 
0
--- 
2014 Q4
0
--- 
2
882 
2014 Q3
7
1 869 
2
1 972 
2014 Q2
4
2 383 
2
1 390 
2014 Q1
3
2 059 
1
644 

Overview of the latest real estate transactions

The following list is an anonymized overview of the latest transactions. For more details and to find all transactions, please use the map to view transactions by plot or the transaction search page for a search by criteria.

2025-06-25
7 000 
292  /m²(24 m²)
Sale
Apartments
Apartment
1 room
24 m2
1 outbuilding
Land
900 m2
-Futaies résineuses
Land
2770 m2
-Prés
2025-06-24
15 500 
517  /m²(30 m²)
Sale
Apartments
Apartment
2 rooms
30 m2
1 outbuilding
Land
51 m2
-Sols
Land
512 m2
-Prés
Land
686 m2
-Prés
Land
1550 m2
-Prés
Land
2924 m2
-Prés
Land
89 m2
-Sols
Land
857 m2
-Prés
Land
1416 m2
-Prés
2025-06-17
14 500 
Sale
Land
1809 m2
-Terres
Land
2341 m2
-Prés
Land
281 m2
-Landes
/Friche
2025-06-09
10 000 
Sale
1 outbuilding
2025-06-05
50 000 
515  /m²(97 m²)
Sale
Commercial property
97 m2
2025-05-12
25 000 
Sale
2 outbuildings
Land
122 m2
-Sols
Land
100 m2
-Jardins
/Jardin maraîcher non aménagé
Land
83 m2
-Jardins
/Jardin maraîcher non aménagé
2025-04-29
9 000 
Sale
Land
2888 m2
-Taillis simples
Land
100 m2
-Sols
2025-04-24
290 000 
2 266  /m²(128 m²)
Sale
Houses
House
4 rooms
128 m2
3 outbuildings
Land
1075 m2
-Sols
2025-04-09
500 
Sale
1 outbuilding
2025-03-28
200 000 
3 571  /m²(56 m²)
Sale
Houses
House
3 rooms
56 m2
Land
200 m2
-Sols
Land
1756 m2
-Prés
2025-03-19
30 000 
789  /m²(38 m²)
Sale
Apartments
Apartment
2 rooms
38 m2
1 outbuilding
Land
2868 m2
-Vergers
/CHAT
Land
410 m2
-Futaies résineuses
Land
55 m2
-Sols
Land
544 m2
-Jardins
/Jardin maraîcher non aménagé
Land
221 m2
-Jardins
/Jardin maraîcher non aménagé
Land
118 m2
-Landes
/Friche
Land
47 m2
-Sols
Land
1384 m2
-Futaies résineuses
Land
2507 m2
-Prés
Land
1720 m2
-Futaies résineuses
Land
1331 m2
-Prés
Land
1416 m2
-Prés
2025-03-11
248 
Sale
Land
248 m2
-Terres
2025-02-12
137 000 
1 489  /m²(92 m²)
Sale
Houses
House
5 rooms
92 m2
Land
25 m2
-Sols
Land
25 m2
-Sols
2025-02-07
32 000 
Sale
Land
149 m2
-Futaies résineuses
Land
682 m2
-Landes
/Pâture plantée
Land
1585 m2
-Terres
Land
1555 m2
-Prés
Land
21 m2
-Sols
Land
48 m2
-Sols
Land
1174 m2
-Landes
/Pâture plantée
Land
1463 m2
-Futaies résineuses
2025-02-07
144 400 
3 522  /m²(41 m²)
Sale
Houses
House
2 rooms
41 m2
Land
4073 m2
-Vergers
/CHAT
Land
1220 m2
-Vergers
/CHAT
2025-02-04
355 000 
5 071  /m²(70 m²)
Sale
Houses
House
3 rooms
70 m2
1 outbuilding
Land
1001 m2
-Sols
Land
254 m2
-Jardins
/Jardin maraîcher non aménagé
2025-01-31
10 000 
Sale
Land
3180 m2
-Prés
2025-01-30
165 600 
1 840  /m²(90 m²)
Sale
Houses
House
4 rooms
90 m2
Land
115 m2
-Sols
Land
144 m2
-Jardins
/Jardin maraîcher non aménagé
2025-01-28
2 000 
Sale
Land
72 m2
-Jardins
/Jardin maraîcher non aménagé
2024-12-27
10 000 
Sale
Land
261 m2
-Jardins
/Jardin maraîcher non aménagé
Land
139 m2
-Futaies résineuses
Land
760 m2
-Landes
/Pâture plantée
Land
2649 m2
-Prés
Land
1304 m2
-Prés
Land
4540 m2
-Futaies résineuses
Land
4300 m2
-Futaies résineuses
492 transactions listed in the municipality

Alpes-Maritimes (06)

Most expensive cities

City
name
Descending orderHouses
house
Price per m²
14 465 
12 406 
11 667 
9 792 
8 307 
8 148 
7 867 
City
name
Descending orderApartments
apt.
Price per m²
9 214 
7 368 
7 188 
7 034 
6 009 
5 627 

Least expensive cities

City
name
Ascending orderHouses
house
Price per m²
768 
833 
833 
851 
860 
1 195 
1 196 
1 220 
1 229 
1 259 
City
name
Ascending orderApartments
apt.
Price per m²
463 
574 
651 
682 
779 
786 
800