emooki
HomePrice mapTransactions
🇬🇧 English🇫🇷 Français🇩🇪 Deutsch🇪🇸 Español🇮🇹 Italiano

Real estate price map


Real estate price map in the municipality of Coaraze, choose a section to see transactions by parcel.

Alpes-Maritimes (06)

Coaraze - Real estate price m²

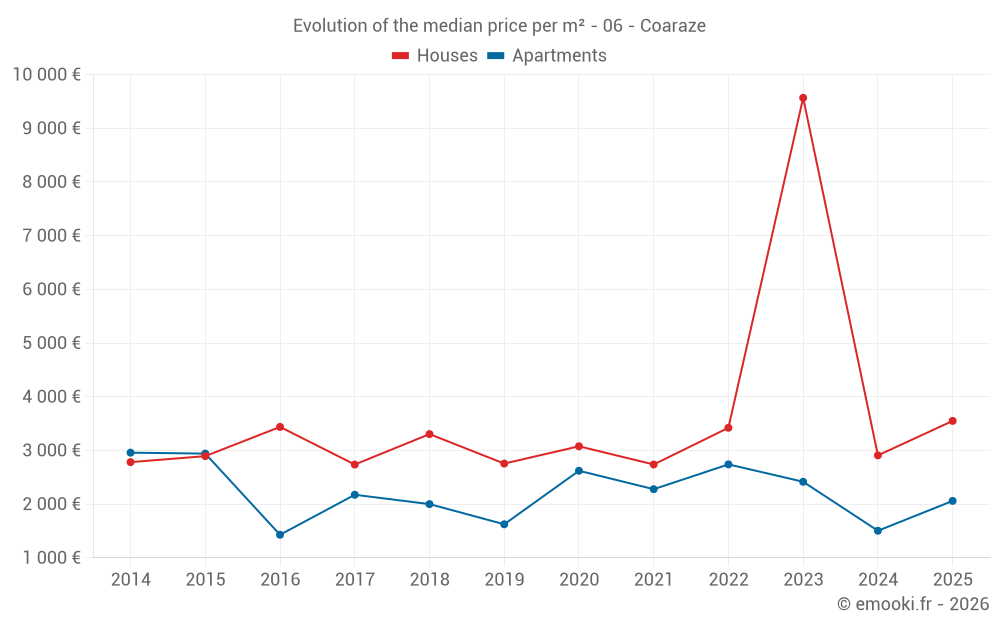
Median price of real estate
in the municipality of Coaraze

HousesHouses
3 264  /m²
1-23-45-67-89-10
Reliability 7/10
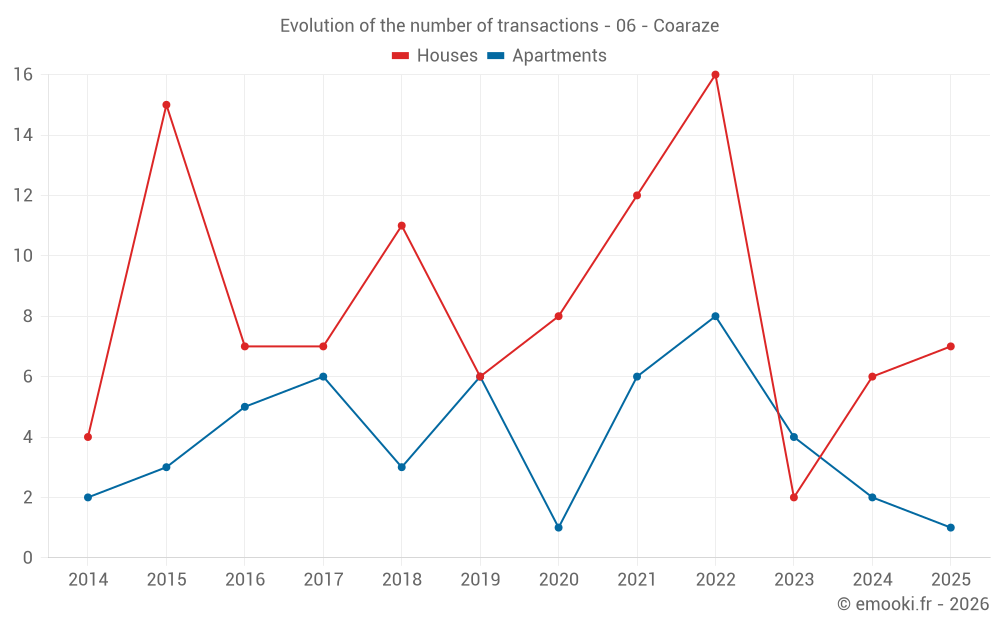
Median price on the 14 transactions of the last 24 months.
from 2 829 to
3 904  /m²
60% of transactions from the 2nd to the 8th deciles.
ApartmentsApartments
2 416  /m²
1-23-45-67-89-10
Reliability 5/10
Median price on the 18 transactions of the last 48 months.
from 1 709 to
2 857  /m²
60% of transactions from the 2nd to the 8th deciles.
DwellingsDwellings
2 908  /m²
1-23-45-67-89-10
Reliability 7/10
Median price on the 20 transactions of the last 24 months.
from 2 094 to
3 722  /m²
60% of transactions from the 2nd to the 8th deciles.
HousesEvolution of the price per m² of houses since...
1 year
+22%
2 years
--
3 years
+3.7%
4 years
+30%
5 years
+15%
6 years
+29%
7 years
+7.4%
8 years
+30%
9 years
+3.3%
10 years
+23%
11 years
+28%

Yearly evolution

Evolution of the median price per m²

Evolution of the median price per m² - 06 - Coaraze

Evolution of the number of transactions

Warning, last year incomplete. Projections made based on the proportions between semesters of the previous year at the departmental/national level and by type of property.

Evolution of the number of transactions - 06 - Coaraze

Yearly data

Descending order
Year
Houses
house
transactions
Houses
house
Price per m²
Apartments
apt.
transactions
Apartments
apt.
Price per m²
2025
7
3 550 
1
2 060 
2024
6
2 908 
2
1 504 
2023
2
9 567 
4
2 416 
2022
16
3 422 
8
2 740 
2021
12
2 738 
6
2 278 
2020
8
3 077 
1
2 621 
2019
6
2 755 
6
1 624 
2018
11
3 304 
3
2 000 
2017
7
2 737 
6
2 174 
2016
7
3 438 
5
1 429 
2015
15
2 894 
3
2 941 
2014
4
2 782 
2
2 958 

Analysis

Structure of prices per m²

Values of price percentiles per m² over the periods used for the estimated price of each type of property.

Structure of transaction amounts

Values of transaction amounts percentiles over the periods used for the estimated price of each type of property.

Transaction amounts and prices per m² by percentile

Ascending order
Percentile
Houses
house
Price per m²
Houses
house
Transaction amount
Apartments
apt.
Price per m²
Apartments
apt.
Transaction amount
10th percentile
2 731 
105 K
1 529 
68 700 
20th percentile
2 829 
142 K
1 709 
109 K
30th percentile
2 959 
276 K
2 059 
127 K
40th percentile
3 028 
316 K
2 094 
137 K
50th percentile
3 264 
322 K
2 416 
142 K
60th percentile
3 511 
345 K
2 701 
166 K
70th percentile
3 701 
366 K
2 770 
184 K
80th percentile
3 904 
472 K
2 857 
197 K
90th percentile
4 449 
494 K
3 346 
215 K

National and departmental comparison

Evolution of the median price per m² of houses

Evolution of the median price per m² of apartments

Quarterly evolution

Evolution of the median price per m²

Evolution of the number of transactions

Quarterly data

Descending order
Quarter
Houses
house
transactions
Houses
house
Price per m²
Apartments
apt.
transactions
Apartments
apt.
Price per m²
2025 Q2
5
3 550 
1
2 060 
2025 Q1
2
3 622 
0
--- 
2024 Q4
0
--- 
2
1 504 
2024 Q3
3
2 807 
0
--- 
2024 Q2
2
2 908 
0
--- 
2024 Q1
1
3 174 
0
--- 
2023 Q4
1
16 150 
2
2 242 
2023 Q3
0
--- 
1
2 450 
2023 Q1
1
2 984 
1
2 893 
2022 Q4
2
2 846 
1
1 725 
2022 Q3
5
2 531 
2
4 044 
2022 Q2
6
3 508 
2
2 112 
2022 Q1
3
3 444 
3
2 703 
2021 Q4
4
2 411 
3
1 698 
2021 Q3
2
1 982 
0
--- 
2021 Q2
4
3 125 
0
--- 
2021 Q1
2
2 490 
3
2 857 
2020 Q4
3
3 038 
0
--- 
2020 Q3
4
3 328 
1
2 621 
2020 Q2
1
3 444 
0
--- 
2019 Q4
0
--- 
3
1 471 
2019 Q3
1
1 912 
1
2 549 
2019 Q2
1
2 292 
1
1 810 
2019 Q1
4
3 462 
1
645 
2018 Q4
3
3 081 
0
--- 
2018 Q3
1
1 563 
0
--- 
2018 Q2
4
3 126 
1
1 791 
2018 Q1
3
3 749 
2
2 800 
2017 Q4
1
1 788 
2
2 364 
2017 Q3
4
2 692 
2
1 772 
2017 Q2
1
2 737 
0
--- 
2017 Q1
1
4 000 
2
2 174 
2016 Q4
3
3 438 
2
1 896 
2016 Q2
1
5 000 
1
476 
2016 Q1
3
3 415 
2
1 143 
2015 Q4
5
3 256 
1
2 941 
2015 Q3
6
2 198 
0
--- 
2015 Q2
4
2 906 
1
3 273 
2015 Q1
0
--- 
1
2 063 
2014 Q4
1
3 000 
0
--- 
2014 Q3
2
3 065 
1
3 333 
2014 Q2
0
--- 
1
2 582 
2014 Q1
1
1 286 
0
--- 

Overview of the latest real estate transactions

The following list is an anonymized overview of the latest transactions. For more details and to find all transactions, please use the map to view transactions by plot or the transaction search page for a search by criteria.

2025-06-23
355 000 
3 550  /m²(100 m²)
Sale
Houses
House
4 rooms
100 m2
1 outbuilding
Land
500 m2
-Sols
Land
1043 m2
-Terrains d'agrément
/Jardin d'agrément
2025-06-06
538 000 
3 927  /m²(137 m²)
Sale
1 outbuilding
Land
174 m2
-Sols
Houses
House
4 rooms
137 m2
Land
500 m2
-Sols
Land
1997 m2
-Terrains d'agrément
/Jardin d'agrément
2025-05-20
172 000 
1 170  /m²(147 m²)
3 440  /m²(50 m²)
Sale
Apartments
Apartment
3 rooms
50 m2
Commercial property
45 m2
Land
132 m2
-Sols
Commercial property
52 m2
2025-05-19
500 000 
4 673  /m²(107 m²)
Sale
Houses
House
5 rooms
107 m2
2 outbuildings
Land
463 m2
-Sols
Land
86 m2
-Vergers
/Oliveraie ou oliviers
Land
107 m2
-Sols
Land
59 m2
-Landes
/Friche
Land
113 m2
-Sols
Land
181 m2
-Sols
Land
80 m2
-Landes
/Friche
Land
4 m2
-Landes
/Friche
2025-04-25
481 660 
2 992  /m²(161 m²)
Sale
Houses
House
4 rooms
161 m2
Land
480 m2
-Vergers
/Oliveraie ou oliviers
Land
476 m2
-Vergers
/Oliveraie ou oliviers
2025-04-16
138 000 
2 060  /m²(67 m²)
Sale
Apartments
Apartment
2 rooms
67 m2
1 outbuilding
2025-04-10
1 000 
Sale
Land
533 m2
-Vignes
Land
558 m2
-Vergers
/Oliveraie ou oliviers
Land
382 m2
-Landes
/Friche
2025-04-10
35 000 
1 944  /m²(18 m²)
Sale
Houses
House
1 room
18 m2
Land
28 m2
-Sols
Land
3742 m2
-Landes
/Pâture plantée
Land
1869 m2
-Vergers
/Oliveraie ou oliviers
Land
4124 m2
-Landes
/Friche
Land
3299 m2
-Terres
Land
6765 m2
-Vergers
/Oliveraie ou oliviers
2025-02-28
466 300 
3 355  /m²(139 m²)
Sale
Houses
House
4 rooms
139 m2
4 outbuildings
Land
2000 m2
-Jardins
/Jardin maraîcher non aménagé
Land
500 m2
-Sols
2025-02-28
350 000 
3 889  /m²(90 m²)
Sale
Houses
House
4 rooms
90 m2
Land
551 m2
-Sols
Land
10 m2
-Vergers
/Oliveraie ou oliviers
Land
24 m2
-Vergers
/Oliveraie ou oliviers
2025-02-27
15 000 
Sale
Land
1490 m2
-Terres
Land
622 m2
-Vergers
/CHAT
Land
1912 m2
-Jardins
/Jardin potager
Land
240 m2
-Sols
Land
744 m2
-Taillis simples
2025-02-26
13 000 
Sale
Land
888 m2
-Vergers
/Oliveraie ou oliviers
2025-02-11
5 000 
Sale
Land
2060 m2
-Vergers
/Oliveraie ou oliviers
2024-12-17
75 000 
949  /m²(79 m²)
Sale
Apartments
Apartment
2 rooms
41 m2
Apartments
Apartment
2 rooms
38 m2
Land
158 m2
-Sols
2024-12-09
23 000 
Sale
Land
320 m2
-Vergers
/Oliveraie ou oliviers
2024-10-29
155 000 
1 703  /m²(91 m²)
2 348  /m²(66 m²)
Sale
Houses
House
4 rooms
66 m2
Commercial property
25 m2
Land
33 m2
-Sols
Land
39 m2
-Sols
2024-10-02
140 000 
2 059  /m²(68 m²)
Sale
Apartments
Apartment
2 rooms
68 m2
2024-09-25
92 000 
3 680  /m²(25 m²)
Sale
Houses
House
1 room
25 m2
Land
1760 m2
-Vergers
/Oliveraie ou oliviers
Land
220 m2
-Sols
2024-09-20
134 900 
2 698  /m²(50 m²)
Sale
Houses
House
3 rooms
50 m2
Land
45 m2
-Sols
2024-09-19
320 000 
2 807  /m²(114 m²)
Sale
Houses
House
4 rooms
114 m2
3 outbuildings
Land
500 m2
-Sols
Land
1145 m2
-Terrains d'agrément
/Jardin d'agrément
Land
3165 m2
-Futaies résineuses
Land
125 m2
-Landes
/Friche
Land
933 m2
-Terres
228 transactions listed in the municipality

Alpes-Maritimes (06)

Most expensive cities

City
name
Descending orderHouses
house
Price per m²
14 465 
12 406 
11 667 
9 792 
8 307 
8 148 
7 867 
City
name
Descending orderApartments
apt.
Price per m²
9 214 
7 368 
7 188 
7 034 
6 009 
5 627 

Least expensive cities

City
name
Ascending orderHouses
house
Price per m²
768 
833 
833 
851 
860 
1 195 
1 196 
1 220 
1 229 
1 259 
City
name
Ascending orderApartments
apt.
Price per m²
463 
574 
651 
682 
779 
786 
800