Median price of real estate
in the municipality of Opio
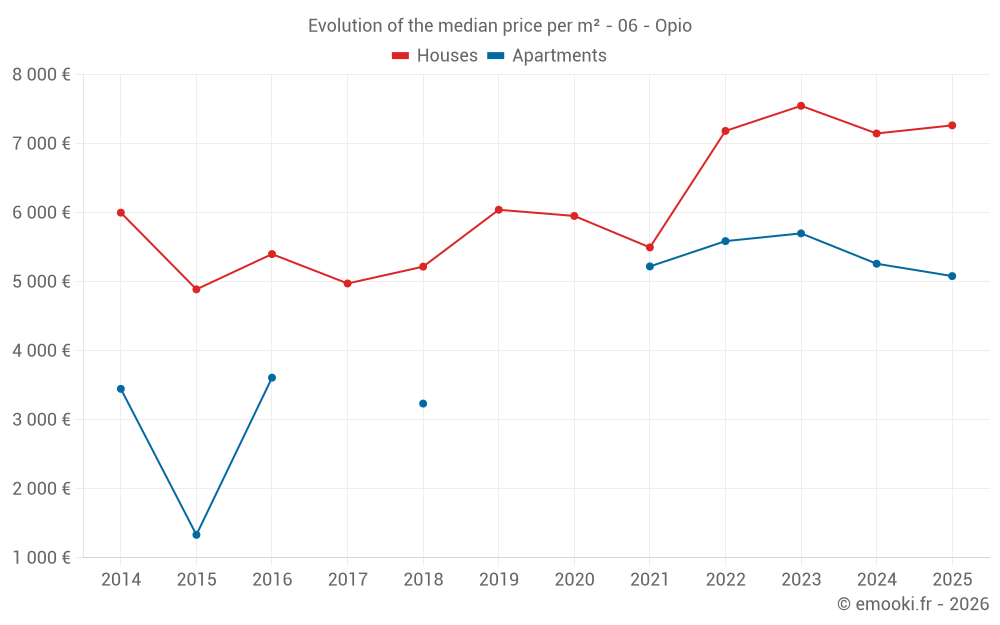
Houses
7 200 € /m²
Reliability 8/10
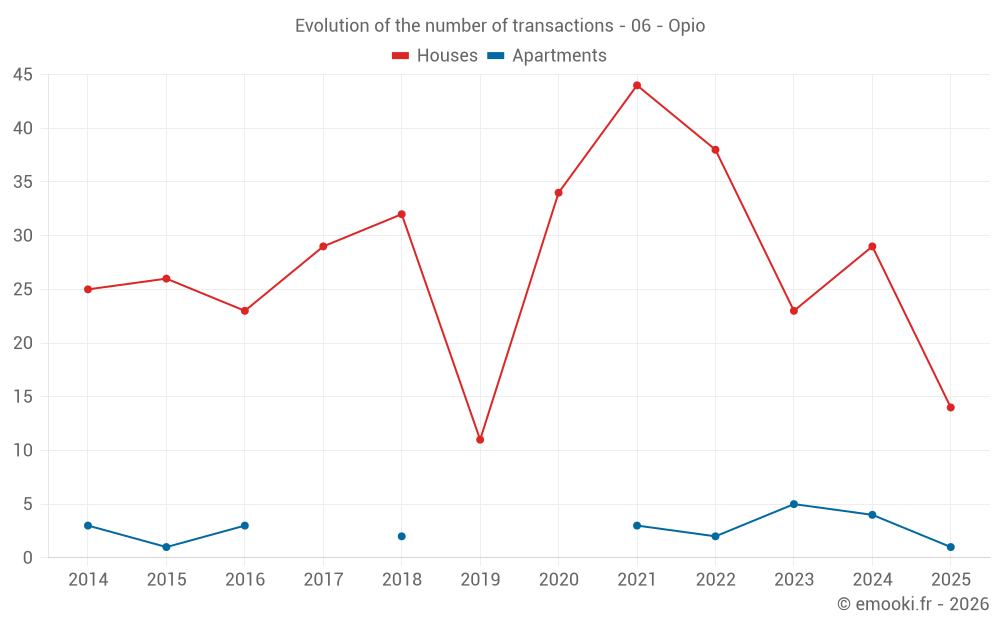
Median price on the 35 transactions of the last 12 months.
from 5 435 to
8 479 € /m²
8 479 € /m²
60% of transactions from the 2nd to the 8th deciles.
Apartments
5 588 € /m²
Reliability 5/10
Median price on the 14 transactions of the last 48 months.
from 4 962 to
6 028 € /m²
6 028 € /m²
60% of transactions from the 2nd to the 8th deciles.
Dwellings
7 130 € /m²
Reliability 8/10
Median price on the 37 transactions of the last 12 months.
from 5 265 to
8 371 € /m²
8 371 € /m²
60% of transactions from the 2nd to the 8th deciles.