emooki
HomePrice mapTransactions
🇬🇧 English🇫🇷 Français🇩🇪 Deutsch🇪🇸 Español🇮🇹 Italiano

Real estate price map


Real estate price map in the municipality of Levens, choose a section to see transactions by parcel.

Alpes-Maritimes (06)

Levens - Real estate price m²

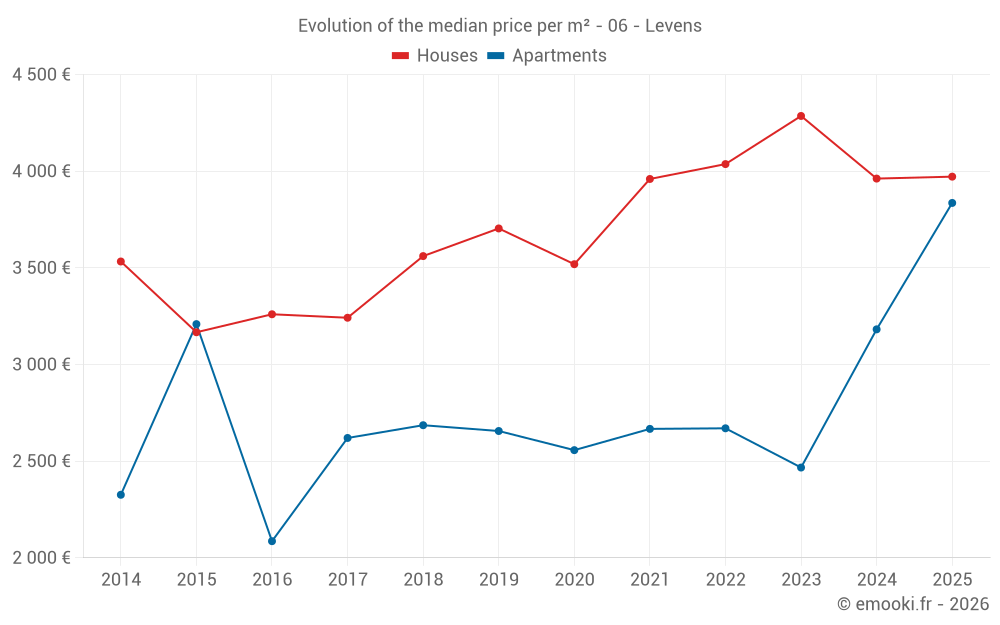
Median price of real estate
in the municipality of Levens

HousesHouses
3 972  /m²
1-23-45-67-89-10
Reliability 9/10
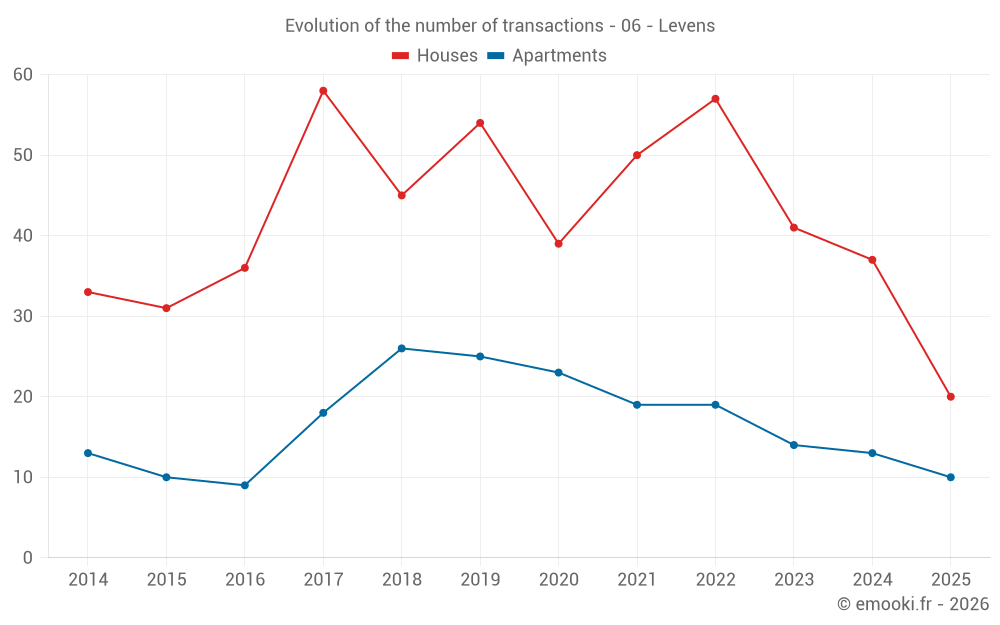
Median price on the 20 transactions of the last 6 months.
from 3 240 to
5 126  /m²
60% of transactions from the 2nd to the 8th deciles.
ApartmentsApartments
3 182  /m²
1-23-45-67-89-10
Reliability 7/10
Median price on the 27 transactions of the last 24 months.
from 2 664 to
4 027  /m²
60% of transactions from the 2nd to the 8th deciles.
DwellingsDwellings
3 902  /m²
1-23-45-67-89-10
Reliability 9/10
Median price on the 30 transactions of the last 6 months.
from 3 131 to
4 539  /m²
60% of transactions from the 2nd to the 8th deciles.
HousesEvolution of the price per m² of houses since...
1 year
+0.3%
2 years
-7.3%
3 years
-1.6%
4 years
+0.3%
5 years
+13%
6 years
+7.2%
7 years
+12%
8 years
+23%
9 years
+22%
10 years
+25%
11 years
+12%
The price per m² of houses has decreased by 7.3% since 2 years, but it has increased by 25% in 10 years.
ApartmentsEvolution of the price per m² of apartments since...
1 year
+21%
2 years
+55%
3 years
+44%
4 years
+44%
5 years
+50%
6 years
+44%
7 years
+43%
8 years
+46%
9 years
+84%
10 years
+20%
11 years
+65%

Yearly evolution

Evolution of the median price per m²

Evolution of the median price per m² - 06 - Levens

Evolution of the number of transactions

Warning, last year incomplete. Projections made based on the proportions between semesters of the previous year at the departmental/national level and by type of property.

Evolution of the number of transactions - 06 - Levens

Yearly data

Descending order
Year
Houses
house
transactions
Houses
house
Price per m²
Apartments
apt.
transactions
Apartments
apt.
Price per m²
2025
20
3 972 
10
3 836 
2024
37
3 962 
13
3 182 
2023
41
4 286 
14
2 467 
2022
57
4 037 
19
2 670 
2021
50
3 960 
19
2 667 
2020
39
3 519 
23
2 557 
2019
54
3 704 
25
2 656 
2018
45
3 561 
26
2 686 
2017
58
3 242 
18
2 620 
2016
36
3 260 
9
2 086 
2015
31
3 167 
10
3 209 
2014
33
3 533 
13
2 326 

Analysis

Structure of prices per m²

Values of price percentiles per m² over the periods used for the estimated price of each type of property.

Structure of transaction amounts

Values of transaction amounts percentiles over the periods used for the estimated price of each type of property.

Transaction amounts and prices per m² by percentile

Ascending order
Percentile
Houses
house
Price per m²
Houses
house
Transaction amount
Apartments
apt.
Price per m²
Apartments
apt.
Transaction amount
10th percentile
1 501 
78 900 
2 194 
101 K
20th percentile
3 240 
291 K
2 664 
136 K
30th percentile
3 502 
370 K
2 959 
148 K
40th percentile
3 839 
426 K
3 117 
199 K
50th percentile
3 972 
476 K
3 182 
213 K
60th percentile
4 289 
484 K
3 674 
261 K
70th percentile
4 546 
498 K
3 834 
286 K
80th percentile
5 126 
582 K
4 027 
339 K
90th percentile
6 308 
627 K
4 536 
359 K

National and departmental comparison

Evolution of the median price per m² of houses

Evolution of the median price per m² of apartments

Quarterly evolution

Evolution of the median price per m²

Evolution of the number of transactions

Quarterly data

Descending order
Quarter
Houses
house
transactions
Houses
house
Price per m²
Apartments
apt.
transactions
Apartments
apt.
Price per m²
2025 Q2
12
3 902 
6
3 836 
2025 Q1
8
4 618 
4
3 562 
2024 Q4
10
4 398 
1
3 692 
2024 Q3
11
2 767 
3
3 182 
2024 Q2
11
3 962 
6
3 194 
2024 Q1
5
4 367 
3
3 141 
2023 Q4
12
4 288 
0
--- 
2023 Q3
13
3 911 
4
2 349 
2023 Q2
9
4 286 
6
2 584 
2023 Q1
7
4 712 
4
2 584 
2022 Q4
15
4 218 
3
2 543 
2022 Q3
16
4 102 
3
1 767 
2022 Q2
14
3 993 
5
2 643 
2022 Q1
12
3 806 
8
2 926 
2021 Q4
14
4 034 
5
3 548 
2021 Q3
13
4 286 
7
2 667 
2021 Q2
13
3 748 
4
2 186 
2021 Q1
10
3 414 
3
2 625 
2020 Q4
15
3 519 
8
2 760 
2020 Q3
9
3 341 
4
2 753 
2020 Q2
7
4 056 
7
2 235 
2020 Q1
8
3 638 
4
3 154 
2019 Q4
18
4 018 
3
2 478 
2019 Q3
16
3 646 
7
2 826 
2019 Q2
12
3 704 
6
2 648 
2019 Q1
8
3 368 
9
2 794 
2018 Q4
14
3 822 
2
2 632 
2018 Q3
13
3 238 
13
3 061 
2018 Q2
11
3 561 
6
2 150 
2018 Q1
7
3 672 
5
1 538 
2017 Q4
17
3 042 
2
3 055 
2017 Q3
16
3 348 
6
2 831 
2017 Q2
20
3 086 
7
2 377 
2017 Q1
5
3 708 
3
2 444 
2016 Q4
8
3 538 
2
1 922 
2016 Q3
10
2 908 
1
2 298 
2016 Q2
6
3 530 
5
2 010 
2016 Q1
12
3 120 
1
2 706 
2015 Q4
10
3 436 
3
3 296 
2015 Q3
12
2 910 
2
3 270 
2015 Q2
4
3 965 
5
2 517 
2015 Q1
5
2 596 
0
--- 
2014 Q4
5
3 426 
3
1 980 
2014 Q3
12
3 598 
5
2 430 
2014 Q2
9
2 890 
4
2 552 
2014 Q1
7
3 533 
1
1 692 

Overview of the latest real estate transactions

The following list is an anonymized overview of the latest transactions. For more details and to find all transactions, please use the map to view transactions by plot or the transaction search page for a search by criteria.

2025-06-26
490 000 
3 267  /m²(150 m²)
Sale
Houses
House
6 rooms
150 m2
Land
619 m2
-Sols
Land
166 m2
-Sols
Land
165 m2
-Sols
2025-06-20
367 000 
Sale
Land
54 m2
-Vergers
Land
338 m2
-Vergers
Land
501 m2
-Sols
2025-06-16
475 000 
4 025  /m²(118 m²)
Sale
Houses
House
3 rooms
118 m2
2 outbuildings
Land
771 m2
-Sols
2025-06-13
292 000 
7 300  /m²(40 m²)
Sale
Land
21 m2
-Sols
Houses
House
2 rooms
40 m2
Land
45 m2
-Sols
Land
723 m2
-Vergers
/Oliveraie ou oliviers
2025-06-12
156 500 
Sale
Land
796 m2
-Terrains d'agrément
Land
158 m2
-Terrains d'agrément
2025-06-11
119 000 
3 839  /m²(31 m²)
Sale
Apartments
Apartment
1 room
31 m2
2025-05-26
387 000 
6 242  /m²(62 m²)
Sale
Houses
House
3 rooms
62 m2
2 outbuildings
Land
500 m2
-Sols
Land
1020 m2
-Terrains d'agrément
2025-05-19
195 000 
Sale
Land
207 m2
-Terrains d'agrément
Land
588 m2
-Terrains à bâtir
2025-05-07
345 000 
3 920  /m²(88 m²)
Sale
Houses
House
4 rooms
88 m2
Land
110 m2
-Sols
Land
928 m2
-Jardins
/Jardin potager
2025-05-05
165 000 
Sale
Land
924 m2
-Terrains d'agrément
2025-05-05
569 000 
Sale
Land
4927 m2
-Prés
2025-05-05
212 000 
Sale
Land
10 m2
-Terrains à bâtir
Land
21 m2
-Prés
Land
887 m2
-Terrains à bâtir
2025-04-28
107 000 
1 877  /m²(57 m²)
Sale
Apartments
Apartment
3 rooms
57 m2
2025-04-28
365 000 
3 650  /m²(100 m²)
Sale
Apartments
Apartment
3 rooms
100 m2
1 outbuilding
2025-04-28
314 300 
3 833  /m²(82 m²)
Sale
Apartments
Apartment
2 rooms
41 m2
Apartments
Apartment
2 rooms
41 m2
2025-04-25
2 500 
Sale
Land
321 m2
-Jardins
Land
1978 m2
-Landes
/Pâture plantée
2025-04-24
285 000 
3 563  /m²(80 m²)
Sale
Houses
House
3 rooms
80 m2
Land
367 m2
-Jardins
/Jardin potager
Land
118 m2
-Terres
Land
46 m2
-Jardins
/Jardin potager
Land
8 m2
-Sols
Land
25 m2
-Sols
2025-04-23
10 000 
Sale
Land
4535 m2
-Landes
/Pâture plantée
2025-04-17
610 000 
4 266  /m²(143 m²)
Sale
Houses
House
5 rooms
143 m2
1 outbuilding
Land
1060 m2
-Sols
Land
195 m2
-Landes
/Pâture plantée
Land
209 m2
-Terrains d'agrément
Land
339 m2
-Jardins
/Jardin potager
2025-04-17
275 250 
4 369  /m²(63 m²)
Sale
Apartments
Apartment
3 rooms
63 m2
1118 transactions listed in the municipality

Alpes-Maritimes (06)

Most expensive cities

City
name
Descending orderHouses
house
Price per m²
14 465 
12 406 
11 667 
9 792 
8 307 
8 148 
7 867 
City
name
Descending orderApartments
apt.
Price per m²
9 214 
7 368 
7 188 
7 034 
6 009 
5 627 

Least expensive cities

City
name
Ascending orderHouses
house
Price per m²
768 
833 
833 
851 
860 
1 195 
1 196 
1 220 
1 229 
1 259 
City
name
Ascending orderApartments
apt.
Price per m²
463 
574 
651 
682 
779 
786 
800