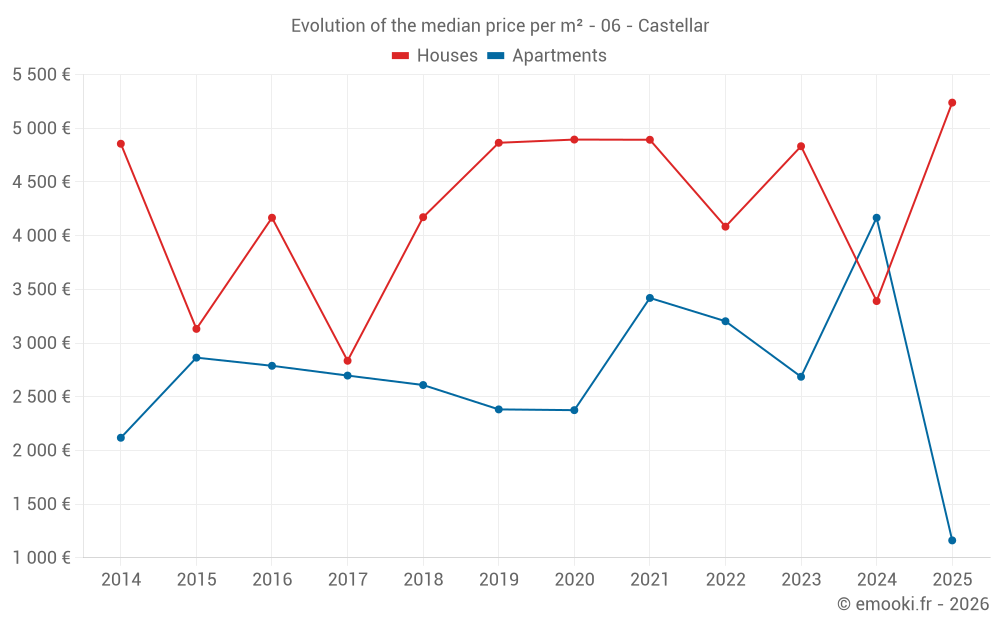
Median price of real estate
in the municipality of Castellar
Houses
4 833 € /m²
Reliability 6/10
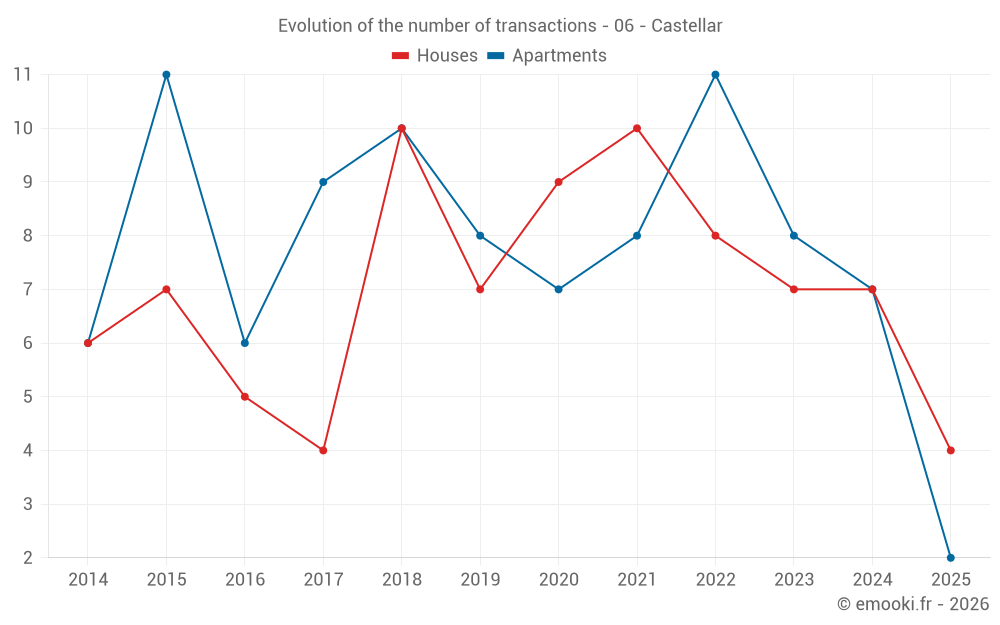
Median price on the 21 transactions of the last 36 months.
from 3 314 to
6 349 € /m²
6 349 € /m²
60% of transactions from the 2nd to the 8th deciles.
Apartments
2 907 € /m²
Reliability 6/10
Median price on the 21 transactions of the last 36 months.
from 2 294 to
5 000 € /m²
5 000 € /m²
60% of transactions from the 2nd to the 8th deciles.
Dwellings
3 387 € /m²
Reliability 7/10
Median price on the 25 transactions of the last 24 months.
from 2 468 to
5 431 € /m²
5 431 € /m²
60% of transactions from the 2nd to the 8th deciles.