emooki
HomePrice mapTransactions
🇬🇧 English🇫🇷 Français🇩🇪 Deutsch🇪🇸 Español🇮🇹 Italiano

Real estate price map


Real estate price map in the municipality of Gréolières, choose a section to see transactions by parcel.

Alpes-Maritimes (06)
Gréolières

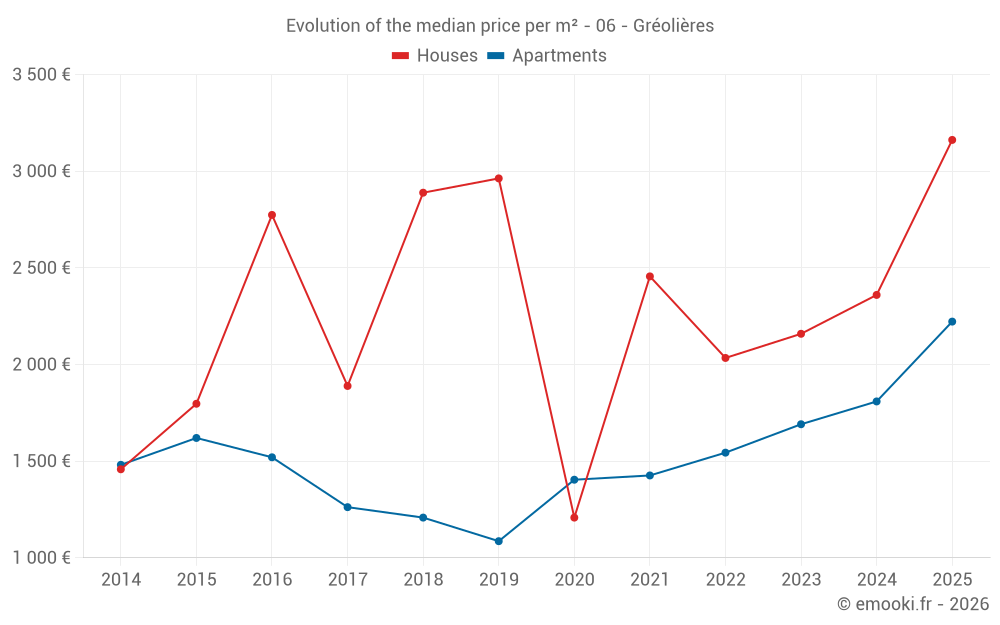
Median price of real estate
in the municipality of Gréolières

HousesHouses
2 360  /m²
1-23-45-67-89-10
Reliability 6/10
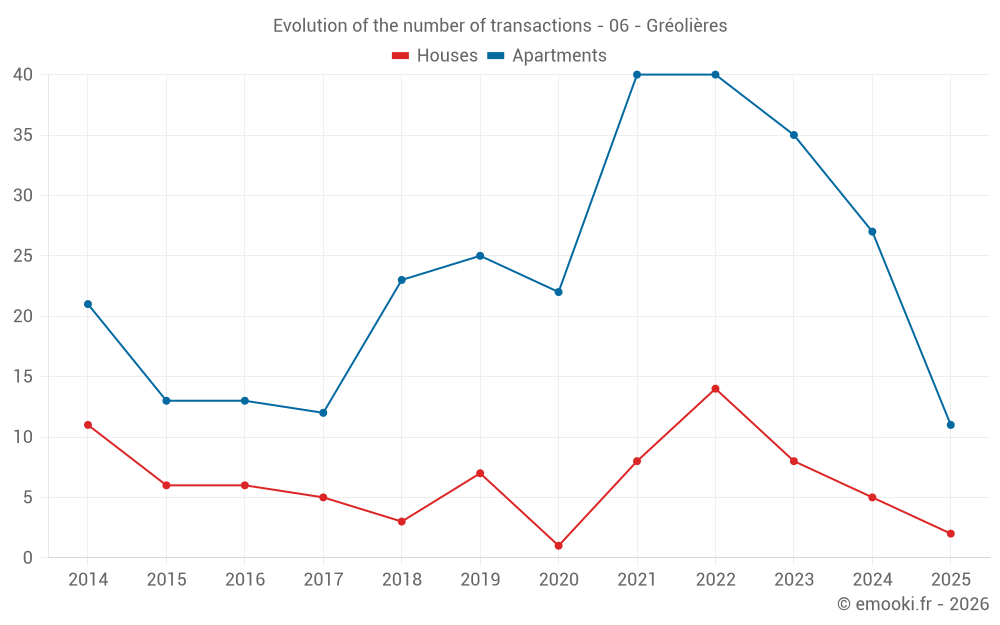
Median price on the 25 transactions of the last 36 months.
from 1 597 to
3 338  /m²
60% of transactions from the 2nd to the 8th deciles.
ApartmentsApartments
2 222  /m²
1-23-45-67-89-10
Reliability 8/10
Median price on the 23 transactions of the last 12 months.
from 1 669 to
2 370  /m²
60% of transactions from the 2nd to the 8th deciles.
DwellingsDwellings
2 222  /m²
1-23-45-67-89-10
Reliability 8/10
Median price on the 27 transactions of the last 12 months.
from 1 529 to
2 480  /m²
60% of transactions from the 2nd to the 8th deciles.
ApartmentsEvolution of the price per m² of apartments since...
1 year
+23%
2 years
+31%
3 years
+44%
4 years
+56%
5 years
+58%
6 years
+105%
7 years
+84%
8 years
+76%
9 years
+46%
10 years
+37%
11 years
+50%

Yearly evolution

Evolution of the median price per m²

Evolution of the number of transactions

Warning, last year incomplete. Projections made based on the proportions between semesters of the previous year at the departmental/national level and by type of property.

Yearly data

Descending order
Year
Houses
house
transactions
Houses
house
Price per m²
Apartments
apt.
transactions
Apartments
apt.
Price per m²
2025
2
3 162 
11
2 222 
2024
5
2 360 
27
1 809 
2023
8
2 159 
35
1 691 
2022
14
2 034 
40
1 544 
2021
8
2 456 
40
1 426 
2020
1
1 208 
22
1 404 
2019
7
2 963 
25
1 086 
2018
3
2 889 
23
1 208 
2017
5
1 889 
12
1 262 
2016
6
2 774 
13
1 520 
2015
6
1 797 
13
1 620 
2014
11
1 458 
21
1 481 

Analysis

Structure of prices per m²

Values of price percentiles per m² over the periods used for the estimated price of each type of property.

Structure of transaction amounts

Values of transaction amounts percentiles over the periods used for the estimated price of each type of property.

Transaction amounts and prices per m² by percentile

Ascending order
Percentile
Houses
house
Price per m²
Houses
house
Transaction amount
Apartments
apt.
Price per m²
Apartments
apt.
Transaction amount
10th percentile
1 002 
58 248 
1 443 
50 415 
20th percentile
1 597 
105 K
1 669 
56 000 
30th percentile
1 690 
146 K
1 943 
62 455 
40th percentile
2 036 
156 K
2 064 
74 848 
50th percentile
2 360 
170 K
2 222 
79 000 
60th percentile
2 975 
176 K
2 229 
85 600 
70th percentile
3 063 
225 K
2 280 
103 K
80th percentile
3 338 
274 K
2 370 
108 K
90th percentile
4 354 
367 K
2 603 
141 K

National and departmental comparison

Evolution of the median price per m² of houses

Evolution of the median price per m² of apartments

Quarterly evolution

Evolution of the median price per m²

Evolution of the number of transactions

Quarterly data

Descending order
Quarter
Houses
house
transactions
Houses
house
Price per m²
Apartments
apt.
transactions
Apartments
apt.
Price per m²
2025 Q2
1
840 
8
2 199 
2025 Q1
1
5 484 
3
2 315 
2024 Q4
1
3 419 
5
2 071 
2024 Q3
1
892 
7
2 222 
2024 Q2
0
--- 
4
1 741 
2024 Q1
3
2 360 
11
1 545 
2023 Q4
3
1 551 
11
1 800 
2023 Q3
3
3 070 
9
1 707 
2023 Q2
1
3 180 
9
1 514 
2023 Q1
1
598 
6
1 580 
2022 Q4
4
2 408 
11
1 857 
2022 Q3
6
2 613 
7
1 565 
2022 Q2
2
2 177 
13
1 333 
2022 Q1
2
884 
9
1 574 
2021 Q4
0
--- 
11
1 667 
2021 Q3
3
3 364 
10
1 270 
2021 Q2
4
1 898 
11
1 405 
2021 Q1
1
2 589 
8
1 436 
2020 Q4
0
--- 
4
1 494 
2020 Q3
1
1 208 
7
1 333 
2020 Q2
0
--- 
6
1 331 
2020 Q1
0
--- 
5
1 612 
2019 Q4
3
1 765 
4
1 581 
2019 Q3
3
4 179 
2
1 025 
2019 Q2
0
--- 
7
1 020 
2019 Q1
1
800 
12
1 052 
2018 Q4
1
2 633 
8
1 054 
2018 Q3
1
3 875 
4
1 598 
2018 Q2
1
2 889 
5
1 208 
2018 Q1
0
--- 
6
1 240 
2017 Q4
1
1 471 
4
1 180 
2017 Q3
0
--- 
2
1 112 
2017 Q2
2
1 548 
3
1 273 
2017 Q1
2
2 400 
3
1 786 
2016 Q4
2
2 072 
4
1 438 
2016 Q3
2
8 970 
5
1 529 
2016 Q2
2
1 824 
2
1 332 
2016 Q1
0
--- 
2
1 550 
2015 Q4
1
3 980 
3
1 840 
2015 Q3
4
1 797 
5
1 613 
2015 Q2
0
--- 
4
1 512 
2015 Q1
1
625 
1
1 628 
2014 Q4
2
1 454 
6
1 586 
2014 Q3
2
2 324 
8
1 398 
2014 Q2
3
906 
4
1 692 
2014 Q1
4
2 298 
3
1 297 

Overview of the latest real estate transactions

The following list is an anonymized overview of the latest transactions. For more details and to find all transactions, please use the map to view transactions by plot or the transaction search page for a search by criteria.

2025-06-27
78 345 
2 176  /m²(36 m²)
Sale
Apartments
Apartment
2 rooms
36 m2
1 outbuilding
2025-06-04
72 000 
2 400  /m²(30 m²)
Sale
Apartments
Apartment
1 room
30 m2
2 outbuildings
2025-06-04
21 000 
840  /m²(25 m²)
Sale
Houses
House
1 room
25 m2
Land
50 m2
-Sols
2025-06-03
103 000 
2 239  /m²(46 m²)
Sale
Apartments
Apartment
2 rooms
46 m2
1 outbuilding
2025-05-19
57 500 
2 500  /m²(23 m²)
Sale
Apartments
Apartment
1 room
23 m2
2025-05-06
49 394 
1 829  /m²(27 m²)
Sale
Apartments
Apartment
1 room
27 m2
2 outbuildings
2025-04-30
20 000 
Sale
1 outbuilding
2025-04-29
54 500 
2 019  /m²(27 m²)
Sale
Apartments
Apartment
2 rooms
27 m2
2025-04-10
75 560 
2 222  /m²(34 m²)
Sale
Apartments
Apartment
1 room
34 m2
1 outbuilding
2025-04-04
149 038 
1 818  /m²(82 m²)
Sale
Apartments
Apartment
3 rooms
82 m2
2 outbuildings
2025-03-27
8 000 
Sale
Land
850 m2
-Vignes
Land
720 m2
-Landes
/Pâture plantée
Land
2740 m2
-Jardins
Land
1670 m2
-Prés
Land
178 m2
-Landes
/Pâture plantée
2025-03-13
6 400 
Sale
Land
6400 m2
-Landes
/Pâture plantée
2025-02-25
147 220 
2 629  /m²(56 m²)
Sale
Apartments
Apartment
4 rooms
56 m2
2 outbuildings
2025-02-06
33 800 
Sale
Land
12340 m2
-Landes
/Friche
Land
1605 m2
-Landes
/Pâture plantée
Land
170 m2
-Sols
Land
21900 m2
-Landes
/Friche
2025-02-04
25 200 
Sale
Land
11050 m2
-Taillis simples
Land
1600 m2
-Taillis simples
Land
9402 m2
-Futaies résineuses
2025-01-31
170 000 
5 484  /m²(31 m²)
Sale
Houses
House
2 rooms
31 m2
Land
21 m2
-Sols
Land
32 m2
-Sols
Land
5 m2
-Sols
2025-01-24
82 000 
1 519  /m²(54 m²)
Sale
Apartments
Apartment
2 rooms
54 m2
1 outbuilding
2025-01-08
125 000 
2 315  /m²(54 m²)
Sale
Apartments
Apartment
2 rooms
54 m2
2024-12-27
20 000 
Sale
1 outbuilding
2024-12-20
400 000 
3 419  /m²(117 m²)
Sale
Houses
House
5 rooms
117 m2
1 outbuilding
Land
1500 m2
-Terres

Alpes-Maritimes (06)

Most expensive cities

City
name
Descending orderHouses
house
Price per m²
14 465 
12 406 
11 667 
9 792 
8 307 
8 148 
7 867 
City
name
Descending orderApartments
apt.
Price per m²
9 214 
7 368 
7 188 
7 034 
6 009 
5 627 

Least expensive cities

City
name
Ascending orderHouses
house
Price per m²
768 
833 
833 
851 
860 
1 195 
1 196 
1 220 
1 229 
1 259 
City
name
Ascending orderApartments
apt.
Price per m²
463 
574 
651 
682 
779 
786 
800