emooki
HomePrice mapTransactions
🇬🇧 English🇫🇷 Français🇩🇪 Deutsch🇪🇸 Español🇮🇹 Italiano

Real estate price map


Real estate price map in the municipality of Clans, choose a section to see transactions by parcel.

Alpes-Maritimes (06)

Clans - Real estate price m²

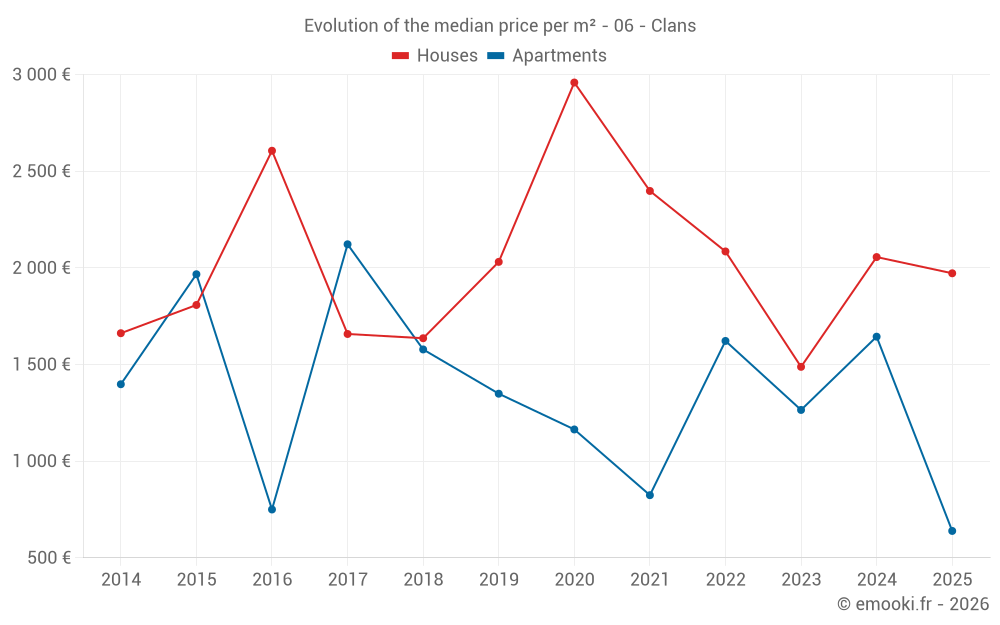
Median price of real estate
in the municipality of Clans

HousesHouses
1 986  /m²
1-23-45-67-89-10
Reliability 7/10
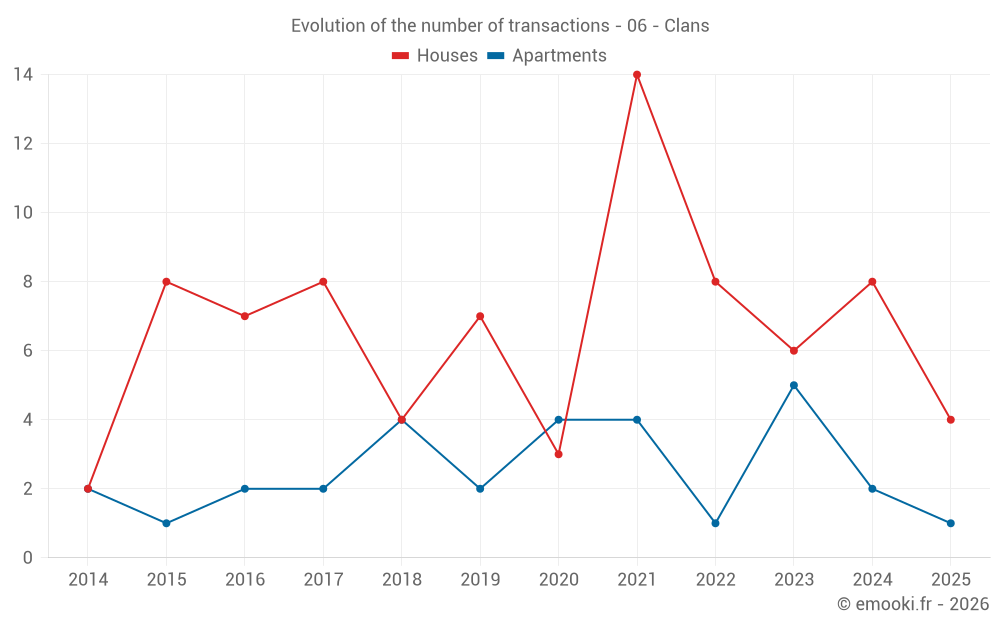
Median price on the 16 transactions of the last 24 months.
from 1 111 to
2 385  /m²
60% of transactions from the 2nd to the 8th deciles.
ApartmentsApartments
1 382  /m²
1-23-45-67-89-10
Reliability 5/10
Median price on the 10 transactions of the last 48 months.
DwellingsDwellings
1 788  /m²
1-23-45-67-89-10
Reliability 7/10
Median price on the 23 transactions of the last 24 months.
from 1 109 to
2 372  /m²
60% of transactions from the 2nd to the 8th deciles.
HousesEvolution of the price per m² of houses since...
1 year
-4.1%
2 years
+33%
3 years
-5.4%
4 years
-18%
5 years
--
6 years
-2.9%
7 years
+21%
8 years
+19%
9 years
-24%
10 years
+9.1%
11 years
--
The price per m² of houses has increased by 33% since 2 years, but it has decreased by 24% in 9 years.

Yearly evolution

Evolution of the median price per m²

Evolution of the median price per m² - 06 - Clans

Evolution of the number of transactions

Warning, last year incomplete. Projections made based on the proportions between semesters of the previous year at the departmental/national level and by type of property.

Evolution of the number of transactions - 06 - Clans

Yearly data

Descending order
Year
Houses
house
transactions
Houses
house
Price per m²
Apartments
apt.
transactions
Apartments
apt.
Price per m²
2025
4
1 972 
1
639 
2024
8
2 056 
2
1 644 
2023
6
1 488 
5
1 265 
2022
8
2 085 
1
1 622 
2021
14
2 398 
4
824 
2020
3
2 959 
4
1 164 
2019
7
2 031 
2
1 349 
2018
4
1 636 
4
1 578 
2017
8
1 658 
2
2 122 
2016
7
2 606 
2
750 
2015
8
1 808 
1
1 967 
2014
2
1 662 
2
1 398 

Analysis

Structure of prices per m²

Values of price percentiles per m² over the periods used for the estimated price of each type of property.

Structure of transaction amounts

Values of transaction amounts percentiles over the periods used for the estimated price of each type of property.

Transaction amounts and prices per m² by percentile

Ascending order
Percentile
Houses
house
Price per m²
Houses
house
Transaction amount
Apartments
apt.
Price per m²
Apartments
apt.
Transaction amount
10th percentile
1 006 
40 325 
718 
38 000 
20th percentile
1 111 
53 320 
873 
42 240 
30th percentile
1 340 
72 250 
942 
54 140 
40th percentile
1 904 
95 380 
1 141 
65 600 
50th percentile
1 986 
104 K
1 382 
71 500 
60th percentile
2 179 
114 K
1 549 
73 800 
70th percentile
2 304 
123 K
1 624 
91 500 
80th percentile
2 385 
155 K
1 660 
142 K
90th percentile
3 062 
173 K
1 853 
192 K

National and departmental comparison

Evolution of the median price per m² of houses

Evolution of the median price per m² of apartments

Quarterly evolution

Evolution of the median price per m²

Evolution of the number of transactions

Quarterly data

Descending order
Quarter
Houses
house
transactions
Houses
house
Price per m²
Apartments
apt.
transactions
Apartments
apt.
Price per m²
2025 Q2
1
1 904 
1
639 
2025 Q1
3
2 040 
0
--- 
2024 Q4
1
2 179 
1
1 500 
2024 Q3
2
2 203 
1
1 788 
2024 Q2
4
1 624 
0
--- 
2024 Q1
1
2 385 
0
--- 
2023 Q4
2
1 584 
1
956 
2023 Q3
2
1 969 
3
1 628 
2023 Q1
2
1 488 
1
727 
2022 Q4
2
2 848 
0
--- 
2022 Q3
1
1 950 
0
--- 
2022 Q2
2
1 133 
0
--- 
2022 Q1
3
3 329 
1
1 622 
2021 Q4
3
2 250 
1
909 
2021 Q3
7
2 653 
0
--- 
2021 Q2
1
3 289 
1
1 071 
2021 Q1
3
1 190 
2
614 
2020 Q4
1
2 959 
1
400 
2020 Q3
0
--- 
1
1 615 
2020 Q2
2
2 618 
1
3 217 
2020 Q1
0
--- 
1
714 
2019 Q4
4
2 508 
2
1 349 
2019 Q3
2
1 426 
0
--- 
2019 Q1
1
1 667 
0
--- 
2018 Q4
0
--- 
2
1 397 
2018 Q3
3
2 143 
1
4 800 
2018 Q1
1
1 129 
1
1 250 
2017 Q4
2
2 250 
0
--- 
2017 Q3
3
1 400 
0
--- 
2017 Q2
2
1 534 
1
3 000 
2017 Q1
1
1 406 
1
1 244 
2016 Q4
2
2 757 
1
625 
2016 Q3
5
2 606 
0
--- 
2016 Q2
0
--- 
1
875 
2015 Q4
4
2 304 
0
--- 
2015 Q2
3
1 681 
1
1 967 
2015 Q1
1
857 
0
--- 
2014 Q4
1
1 125 
0
--- 
2014 Q3
1
2 200 
0
--- 
2014 Q2
0
--- 
1
1 167 
2014 Q1
0
--- 
1
1 628 

Overview of the latest real estate transactions

The following list is an anonymized overview of the latest transactions. For more details and to find all transactions, please use the map to view transactions by plot or the transaction search page for a search by criteria.

2025-06-06
53 320 
1 904  /m²(28 m²)
Sale
Houses
House
1 room
28 m2
Land
107 m2
-Sols
Land
500 m2
-Sols
Land
2179 m2
-Landes
2025-04-28
42 800 
639  /m²(67 m²)
Sale
Apartments
Apartment
2 rooms
37 m2
Apartments
Apartment
1 room
30 m2
3 outbuildings
2025-04-02
1 
Sale
Land
1505 m2
-Landes
2025-03-05
120 000 
1 364  /m²(88 m²)
Sale
Houses
House
4 rooms
88 m2
Land
59 m2
-Sols
2025-02-28
112 200 
2 040  /m²(55 m²)
Sale
Houses
House
2 rooms
55 m2
Land
32 m2
-Sols
2025-02-07
185 000 
2 256  /m²(82 m²)
Sale
Houses
House
4 rooms
82 m2
1 outbuilding
Land
1003 m2
-Sols
2025-01-07
2 500 
Sale
Land
1733 m2
-Prés
2024-12-27
80 000 
Sale
1 outbuilding
2024-12-06
75 000 
1 500  /m²(50 m²)
Sale
Apartments
Apartment
3 rooms
50 m2
1 outbuilding
2024-12-06
5 000 
Sale
Land
20 m2
-Sols
2024-12-04
95 880 
2 179  /m²(44 m²)
Sale
Houses
House
2 rooms
44 m2
Land
23 m2
-Sols
2024-12-02
1 000 
Sale
Land
52 m2
-Jardins
/Jardin potager
2024-10-03
2 000 
Sale
Land
67 m2
-Jardins
/Jardin potager
2024-08-19
56 500 
1 108  /m²(51 m²)
Sale
Houses
House
1 room
19 m2
Houses
House
1 room
32 m2
Land
32 m2
-Sols
2024-08-08
10 000 
Sale
Land
260 m2
-Futaies résineuses
Land
1350 m2
-Prés
Land
178 m2
-Landes
Land
2035 m2
-Terres
Land
4680 m2
-Futaies résineuses
Land
2020 m2
-Landes
Land
155 m2
-Landes
Land
720 m2
-Landes
Land
120 m2
-Sols
Land
6700 m2
-Futaies résineuses
Land
275 m2
-Landes
Land
490 m2
-Futaies résineuses
Land
221 m2
-Futaies résineuses
Land
124 m2
-Futaies résineuses
Land
913 m2
-Futaies résineuses
Land
277 m2
-Futaies résineuses
Land
1431 m2
-Landes
Land
61 m2
-Landes
Land
1410 m2
-Landes
2024-08-08
12 000 
Sale
Land
22 m2
-Sols
2024-08-05
155 000 
3 298  /m²(47 m²)
Sale
Houses
House
3 rooms
47 m2
Land
37 m2
-Sols
2024-07-29
295 000 
1 844  /m²(160 m²)
2 458  /m²(120 m²)
Sale
Apartments
Apartment
5 rooms
120 m2
Commercial property
40 m2
1 outbuilding
Land
770 m2
-Sols
2024-07-23
59 000 
1 788  /m²(33 m²)
Sale
Apartments
Apartment
1 room
33 m2
1 outbuilding
2024-07-09
1 000 
Sale
Land
158 m2
-Sols
224 transactions listed in the municipality

Alpes-Maritimes (06)

Most expensive cities

City
name
Descending orderHouses
house
Price per m²
14 465 
12 406 
11 667 
9 792 
8 307 
8 148 
7 867 
City
name
Descending orderApartments
apt.
Price per m²
9 214 
7 368 
7 188 
7 034 
6 009 
5 627 

Least expensive cities

City
name
Ascending orderHouses
house
Price per m²
768 
833 
833 
851 
860 
1 195 
1 196 
1 220 
1 229 
1 259 
City
name
Ascending orderApartments
apt.
Price per m²
463 
574 
651 
682 
779 
786 
800