emooki
HomePrice mapTransactions
🇬🇧 English🇫🇷 Français🇩🇪 Deutsch🇪🇸 Español🇮🇹 Italiano

Real estate price map


Real estate price map in the municipality of Èze, choose a section to see transactions by parcel.

Alpes-Maritimes (06)
Èze

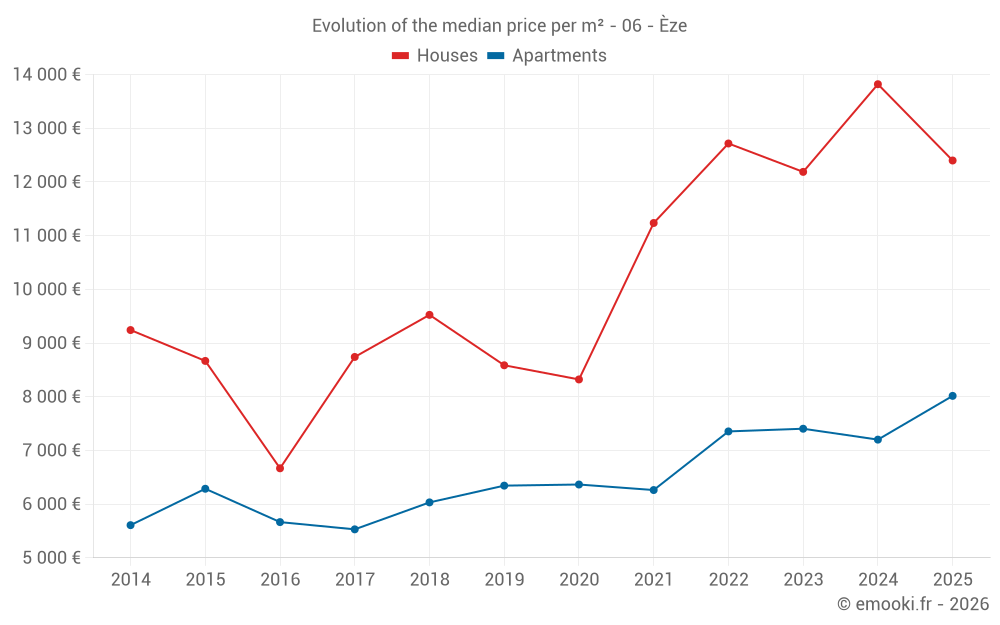
Median price of real estate
in the municipality of Èze

HousesHouses
12 406  /m²
1-23-45-67-89-10
Reliability 8/10
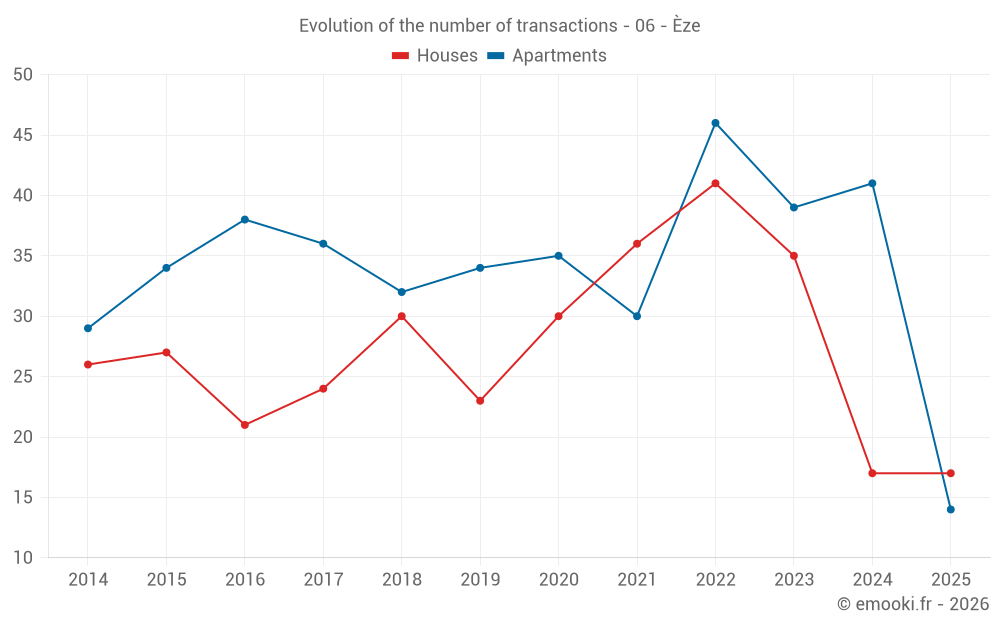
Median price on the 27 transactions of the last 12 months.
from 9 459 to
16 503  /m²
60% of transactions from the 2nd to the 8th deciles.
ApartmentsApartments
9 214  /m²
1-23-45-67-89-10
Reliability 8/10
Median price on the 30 transactions of the last 12 months.
from 6 217 to
13 561  /m²
60% of transactions from the 2nd to the 8th deciles.
DwellingsDwellings
10 563  /m²
1-23-45-67-89-10
Reliability 9/10
Median price on the 31 transactions of the last 6 months.
from 6 333 to
16 522  /m²
60% of transactions from the 2nd to the 8th deciles.
HousesEvolution of the price per m² of houses since...
1 year
-10%
2 years
+1.7%
3 years
-2.5%
4 years
+10%
5 years
+49%
6 years
+44%
7 years
+30%
8 years
+42%
9 years
+86%
10 years
+43%
11 years
+34%
The price per m² of houses has decreased by 10% since 1 year, but it has increased by 86% in 9 years.
ApartmentsEvolution of the price per m² of apartments since...
1 year
+11%
2 years
+8.3%
3 years
+9%
4 years
+28%
5 years
+26%
6 years
+26%
7 years
+33%
8 years
+45%
9 years
+42%
10 years
+28%
11 years
+43%

Yearly evolution

Evolution of the median price per m²

Evolution of the number of transactions

Warning, last year incomplete. Projections made based on the proportions between semesters of the previous year at the departmental/national level and by type of property.

Yearly data

Descending order
Year
Houses
house
transactions
Houses
house
Price per m²
Apartments
apt.
transactions
Apartments
apt.
Price per m²
2025
17
12 400 
14
8 016 
2024
17
13 821 
41
7 201 
2023
35
12 188 
39
7 404 
2022
41
12 717 
46
7 354 
2021
36
11 236 
30
6 262 
2020
30
8 322 
35
6 365 
2019
23
8 586 
34
6 344 
2018
30
9 525 
32
6 032 
2017
24
8 741 
36
5 530 
2016
21
6 667 
38
5 665 
2015
27
8 667 
34
6 286 
2014
26
9 242 
29
5 608 

Analysis

Structure of prices per m²

Values of price percentiles per m² over the periods used for the estimated price of each type of property.

Structure of transaction amounts

Values of transaction amounts percentiles over the periods used for the estimated price of each type of property.

Transaction amounts and prices per m² by percentile

Ascending order
Percentile
Houses
house
Price per m²
Houses
house
Transaction amount
Apartments
apt.
Price per m²
Apartments
apt.
Transaction amount
10th percentile
6 739 
524 K
5 251 
188 K
20th percentile
9 459 
806 K
6 217 
272 K
30th percentile
9 547 
1 103 K
6 986 
326 K
40th percentile
11 370 
1 300 K
7 323 
492 K
50th percentile
12 406 
1 600 K
9 214 
542 K
60th percentile
14 893 
1 726 K
10 686 
738 K
70th percentile
15 933 
1 900 K
11 491 
821 K
80th percentile
16 503 
2 540 K
13 561 
886 K
90th percentile
17 722 
3 220 K
18 823 
1 440 K

National and departmental comparison

Evolution of the median price per m² of houses

Evolution of the median price per m² of apartments

Quarterly evolution

Evolution of the median price per m²

Evolution of the number of transactions

Quarterly data

Descending order
Quarter
Houses
house
transactions
Houses
house
Price per m²
Apartments
apt.
transactions
Apartments
apt.
Price per m²
2025 Q2
7
10 734 
3
7 333 
2025 Q1
10
14 041 
11
8 455 
2024 Q4
5
15 916 
7
10 714 
2024 Q3
5
12 324 
9
7 201 
2024 Q2
5
10 227 
13
6 971 
2024 Q1
2
16 078 
12
6 913 
2023 Q4
8
10 606 
12
7 166 
2023 Q3
10
15 400 
10
8 624 
2023 Q2
8
12 071 
10
8 008 
2023 Q1
9
9 044 
7
6 382 
2022 Q4
11
12 717 
15
7 064 
2022 Q3
10
16 224 
11
8 582 
2022 Q2
14
10 326 
11
8 707 
2022 Q1
6
15 626 
9
6 308 
2021 Q4
7
11 899 
7
7 016 
2021 Q3
8
10 882 
10
6 000 
2021 Q2
12
12 167 
4
6 708 
2021 Q1
9
9 202 
9
6 273 
2020 Q4
12
7 082 
13
6 397 
2020 Q3
6
8 474 
4
6 243 
2020 Q2
6
10 749 
7
5 488 
2020 Q1
6
8 782 
11
6 383 
2019 Q4
5
5 741 
9
6 388 
2019 Q3
7
7 438 
6
5 378 
2019 Q2
5
10 000 
7
6 301 
2019 Q1
6
8 722 
12
7 625 
2018 Q4
9
10 513 
14
5 534 
2018 Q3
9
6 923 
8
6 032 
2018 Q2
7
8 871 
5
7 639 
2018 Q1
5
9 620 
5
6 522 
2017 Q4
5
7 708 
10
5 662 
2017 Q3
5
13 014 
5
5 824 
2017 Q2
9
9 052 
13
5 176 
2017 Q1
5
8 732 
8
6 014 
2016 Q4
6
7 159 
5
5 965 
2016 Q3
6
6 578 
12
6 150 
2016 Q2
6
5 964 
10
5 170 
2016 Q1
3
6 667 
11
5 250 
2015 Q4
7
8 379 
12
6 831 
2015 Q3
8
7 636 
4
5 744 
2015 Q2
6
7 768 
12
6 286 
2015 Q1
6
13 462 
6
4 634 
2014 Q4
8
8 378 
7
5 938 
2014 Q3
11
6 818 
9
5 962 
2014 Q2
2
11 136 
9
5 588 
2014 Q1
5
14 826 
4
4 842 

Overview of the latest real estate transactions

The following list is an anonymized overview of the latest transactions. For more details and to find all transactions, please use the map to view transactions by plot or the transaction search page for a search by criteria.

2025-06-13
3 493 450 
17 380  /m²(201 m²)
Sale
Houses
House
7 rooms
201 m2
1 outbuilding
Land
745 m2
-Sols
2025-06-11
1 000 
Sale
Land
13525 m2
-Futaies résineuses
Land
56 m2
-Landes
/Friche
Land
342 m2
-Landes
/Pâture plantée
Land
5643 m2
-Futaies résineuses
Land
450 m2
-Landes
/Friche
2025-06-02
2 300 000 
14 935  /m²(154 m²)
Sale
Houses
House
5 rooms
154 m2
1 outbuilding
Land
470 m2
-Sols
2025-05-27
620 000 
12 400  /m²(50 m²)
Sale
Land
275 m2
-Terrains d'agrément
/Jardin d'agrément
Houses
House
2 rooms
50 m2
Land
43 m2
-Sols
2025-05-19
15 000 
113  /m²(133 m²)
Sale
Houses
House
5 rooms
133 m2
1 outbuilding
2025-05-13
560 000 
12 444  /m²(45 m²)
Sale
Apartments
Apartment
2 rooms
45 m2
1 outbuilding
2025-05-07
45 000 
2 250  /m²(20 m²)
Sale
Apartments
Apartment
1 room
20 m2
1 outbuilding
2025-04-30
1 690 000 
10 563  /m²(160 m²)
Sale
Houses
House
5 rooms
160 m2
1 outbuilding
Land
213 m2
-Sols
1 outbuilding
Land
4000 m2
-Futaies résineuses
Land
529 m2
-Sols
2025-04-17
1 900 000 
10 734  /m²(177 m²)
Sale
Houses
House
9 rooms
177 m2
Land
857 m2
-Sols
2025-04-03
380 000 
6 333  /m²(60 m²)
Sale
Houses
House
2 rooms
60 m2
Land
498 m2
-Sols
Land
31 m2
-Terres
2025-04-01
550 000 
7 333  /m²(75 m²)
Sale
Apartments
Apartment
3 rooms
75 m2
2 outbuildings
2025-03-31
1 800 000 
18 000  /m²(100 m²)
Sale
Apartments
Apartment
3 rooms
100 m2
2 outbuildings
2025-03-27
2 900 000 
15 676  /m²(185 m²)
Sale
Houses
House
6 rooms
185 m2
1 outbuilding
Land
1502 m2
-Sols
2025-03-27
534 300 
6 286  /m²(85 m²)
Sale
Apartments
Apartment
3 rooms
85 m2
2 outbuildings
2025-03-27
1 400 000 
18 667  /m²(75 m²)
Sale
Apartments
Apartment
4 rooms
75 m2
2 outbuildings
2025-03-26
2 600 000 
9 455  /m²(275 m²)
Sale
Houses
House
7 rooms
275 m2
1 outbuilding
Land
660 m2
-Sols
Land
507 m2
-Terrains d'agrément
/Jardin d'agrément
2025-03-18
2 820 000 
Sale
Land
2501 m2
-Terrains à bâtir
Land
2501 m2
-Terrains à bâtir
2025-03-13
3 100 000 
18 235  /m²(170 m²)
Sale
Houses
House
4 rooms
170 m2
1 outbuilding
Land
1944 m2
-Terrains d'agrément
/Parc
2025-03-12
259 500 
3 816  /m²(68 m²)
Sale
Apartments
Apartment
3 rooms
68 m2
3 outbuildings
2025-03-07
389 000 
9 974  /m²(39 m²)
Sale
Apartments
Apartment
2 rooms
39 m2
1 outbuilding
1081 transactions listed in the municipality

Alpes-Maritimes (06)

Most expensive cities

City
name
Descending orderHouses
house
Price per m²
14 465 
12 406 
11 667 
9 792 
8 307 
8 148 
7 867 
City
name
Descending orderApartments
apt.
Price per m²
9 214 
7 368 
7 188 
7 034 
6 009 
5 627 

Least expensive cities

City
name
Ascending orderHouses
house
Price per m²
768 
833 
833 
851 
860 
1 195 
1 196 
1 220 
1 229 
1 259 
City
name
Ascending orderApartments
apt.
Price per m²
463 
574 
651 
682 
779 
786 
800