emooki
HomePrice mapTransactions
🇬🇧 English🇫🇷 Français🇩🇪 Deutsch🇪🇸 Español🇮🇹 Italiano

Real estate price map


Real estate price map in the municipality of Breil-sur-Roya, choose a section to see transactions by parcel.

Alpes-Maritimes (06)

Breil-sur-Roya - Real estate price m²

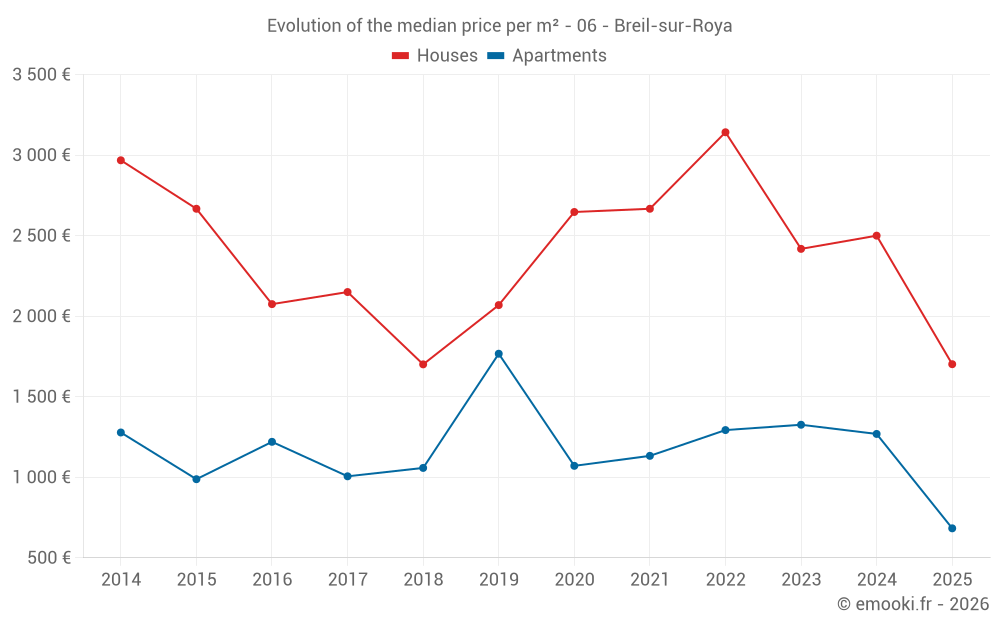
Median price of real estate
in the municipality of Breil-sur-Roya

HousesHouses
2 460  /m²
1-23-45-67-89-10
Reliability 7/10
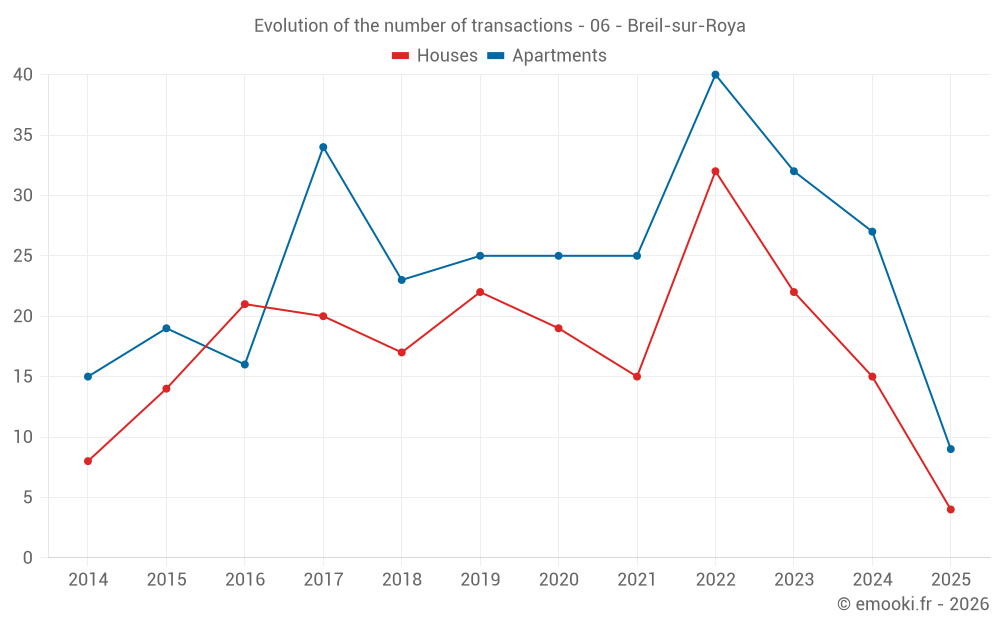
Median price on the 32 transactions of the last 24 months.
from 1 299 to
3 606  /m²
60% of transactions from the 2nd to the 8th deciles.
ApartmentsApartments
1 189  /m²
1-23-45-67-89-10
Reliability 8/10
Median price on the 21 transactions of the last 12 months.
from 600 to
2 047  /m²
60% of transactions from the 2nd to the 8th deciles.
DwellingsDwellings
1 571  /m²
1-23-45-67-89-10
Reliability 8/10
Median price on the 31 transactions of the last 12 months.
from 683 to
2 370  /m²
60% of transactions from the 2nd to the 8th deciles.
HousesEvolution of the price per m² of houses since...
1 year
-32%
2 years
-30%
3 years
-46%
4 years
-36%
5 years
-36%
6 years
-18%
7 years
+0.1%
8 years
-21%
9 years
-18%
10 years
-36%
11 years
-43%
The price per m² of houses has decreased by 46% since 3 years, but it has increased by 0.1% in 7 years.
ApartmentsEvolution of the price per m² of apartments since...
1 year
-46%
2 years
-48%
3 years
-47%
4 years
-40%
5 years
-36%
6 years
-61%
7 years
-35%
8 years
-32%
9 years
-44%
10 years
-31%
11 years
-47%

Yearly evolution

Evolution of the median price per m²

Evolution of the median price per m² - 06 - Breil-sur-Roya

Evolution of the number of transactions

Warning, last year incomplete. Projections made based on the proportions between semesters of the previous year at the departmental/national level and by type of property.

Evolution of the number of transactions - 06 - Breil-sur-Roya

Yearly data

Descending order
Year
Houses
house
transactions
Houses
house
Price per m²
Apartments
apt.
transactions
Apartments
apt.
Price per m²
2025
4
1 702 
9
683 
2024
15
2 500 
27
1 269 
2023
22
2 418 
32
1 326 
2022
32
3 142 
40
1 293 
2021
15
2 667 
25
1 133 
2020
19
2 647 
25
1 071 
2019
22
2 069 
25
1 767 
2018
17
1 701 
23
1 058 
2017
20
2 150 
34
1 006 
2016
21
2 075 
16
1 220 
2015
14
2 667 
19
988 
2014
8
2 968 
15
1 278 

Analysis

Structure of prices per m²

Values of price percentiles per m² over the periods used for the estimated price of each type of property.

Structure of transaction amounts

Values of transaction amounts percentiles over the periods used for the estimated price of each type of property.

Transaction amounts and prices per m² by percentile

Ascending order
Percentile
Houses
house
Price per m²
Houses
house
Transaction amount
Apartments
apt.
Price per m²
Apartments
apt.
Transaction amount
10th percentile
497 
35 000 
480 
30 000 
20th percentile
1 299 
65 200 
600 
32 100 
30th percentile
1 890 
93 000 
790 
41 000 
40th percentile
2 348 
118 K
1 043 
45 000 
50th percentile
2 460 
148 K
1 189 
58 900 
60th percentile
2 801 
189 K
1 473 
62 300 
70th percentile
3 161 
238 K
1 723 
65 000 
80th percentile
3 606 
298 K
2 047 
110 K
90th percentile
4 282 
376 K
2 171 
145 K

National and departmental comparison

Evolution of the median price per m² of houses

Evolution of the median price per m² of apartments

Quarterly evolution

Evolution of the median price per m²

Evolution of the number of transactions

Quarterly data

Descending order
Quarter
Houses
house
transactions
Houses
house
Price per m²
Apartments
apt.
transactions
Apartments
apt.
Price per m²
2025 Q2
1
200 
6
736 
2025 Q1
3
2 182 
3
600 
2024 Q4
5
3 165 
9
1 473 
2024 Q3
1
2 857 
3
1 189 
2024 Q2
7
1 667 
7
1 462 
2024 Q1
2
1 365 
8
1 132 
2023 Q4
6
2 791 
8
1 554 
2023 Q3
7
2 390 
9
1 300 
2023 Q2
6
1 702 
7
1 035 
2023 Q1
3
3 325 
8
1 489 
2022 Q4
14
2 678 
13
1 279 
2022 Q3
8
3 620 
6
1 544 
2022 Q2
5
3 385 
10
1 106 
2022 Q1
5
1 357 
11
1 400 
2021 Q4
1
3 543 
6
1 056 
2021 Q3
8
2 418 
12
1 248 
2021 Q2
5
2 679 
4
613 
2021 Q1
1
229 
3
709 
2020 Q4
8
2 374 
3
1 083 
2020 Q3
4
2 590 
7
1 343 
2020 Q2
4
3 586 
8
890 
2020 Q1
3
1 250 
7
897 
2019 Q4
7
2 345 
9
2 000 
2019 Q3
3
1 100 
6
1 804 
2019 Q2
9
2 079 
4
2 176 
2019 Q1
3
1 653 
6
1 258 
2018 Q4
4
2 488 
5
1 058 
2018 Q3
5
1 850 
1
1 075 
2018 Q2
3
833 
8
1 018 
2018 Q1
5
1 579 
9
1 593 
2017 Q4
6
2 434 
11
883 
2017 Q3
2
1 636 
8
1 098 
2017 Q2
6
1 937 
8
1 070 
2017 Q1
6
2 833 
7
1 541 
2016 Q4
7
1 806 
7
1 042 
2016 Q3
6
1 975 
5
1 462 
2016 Q2
3
1 464 
3
1 260 
2016 Q1
5
2 809 
1
1 750 
2015 Q4
6
3 018 
10
1 024 
2015 Q3
3
1 875 
1
913 
2015 Q2
4
2 714 
2
700 
2015 Q1
1
5 100 
6
1 844 
2014 Q4
0
--- 
6
1 516 
2014 Q3
4
2 968 
3
1 250 
2014 Q2
3
3 250 
2
416 
2014 Q1
1
516 
4
1 520 

Overview of the latest real estate transactions

The following list is an anonymized overview of the latest transactions. For more details and to find all transactions, please use the map to view transactions by plot or the transaction search page for a search by criteria.

2025-06-27
100 
Sale
Land
532 m2
-Landes
/Pâture plantée
2025-06-26
2 000 
Sale
Land
200 m2
-Prés
2025-06-25
1 000 
Sale
Land
1267 m2
-Landes
/Pâture plantée
Land
1850 m2
-Vergers
/Oliveraie ou oliviers
Land
4 m2
-Eaux
/CANAL
Land
71 m2
-Eaux
/CANAL
Land
35 m2
-Eaux
/CANAL
Land
48 m2
-Eaux
/CANAL
Land
463 m2
-Vergers
/Oliveraie ou oliviers
Land
241 m2
-Vergers
/Oliveraie ou oliviers
2025-06-10
265 000 
515  /m²(515 m²)
4 077  /m²(65 m²)
Sale
Apartments
Apartment
2 rooms
65 m2
Commercial property
450 m2
1 outbuilding
2025-06-02
62 300 
2 225  /m²(28 m²)
Sale
Apartments
Apartment
1 room
28 m2
2025-05-19
41 000 
683  /m²(60 m²)
Sale
Apartments
Apartment
3 rooms
60 m2
2 outbuildings
2025-05-09
110 000 
1 571  /m²(70 m²)
Sale
Apartments
Apartment
3 rooms
70 m2
1 outbuilding
2025-05-06
45 000 
563  /m²(80 m²)
Sale
Apartments
Apartment
2 rooms
80 m2
2025-05-05
65 000 
387  /m²(168 m²)
Sale
Apartments
Apartment
2 rooms
80 m2
Apartments
Apartment
3 rooms
88 m2
1 outbuilding
2025-04-18
360 
Sale
Land
72 m2
-Landes
/Pâture plantée
2025-04-10
3 000 
200  /m²(15 m²)
Sale
Houses
House
2 rooms
15 m2
1 outbuilding
Land
124 m2
-Sols
Land
1739 m2
-Taillis simples
Land
3367 m2
-Terres
Land
1910 m2
-Taillis simples
2025-04-10
1 000 
Sale
Land
1470 m2
-Landes
/Pâture plantée
Land
1410 m2
-Vergers
/Oliveraie ou oliviers
Land
1745 m2
-Prés
Land
896 m2
-Vergers
/Oliveraie ou oliviers
Land
564 m2
-Terres
Land
1308 m2
-Vergers
/Oliveraie ou oliviers
Land
1770 m2
-Taillis simples
2025-04-07
30 800 
790  /m²(39 m²)
Sale
Apartments
Apartment
2 rooms
39 m2
1 outbuilding
2025-03-28
4 500 
Sale
Land
2248 m2
-Vergers
/Oliveraie ou oliviers
2025-03-25
146 667 
2 037  /m²(72 m²)
Sale
Apartments
Apartment
4 rooms
72 m2
3 outbuildings
1 outbuilding
2025-03-24
16 500 
Sale
Land
125 m2
-Sols
Land
803 m2
-Terres
2025-03-24
23 600 
Sale
Land
1956 m2
-Prés
2025-03-24
30 000 
600  /m²(50 m²)
Sale
Apartments
Apartment
3 rooms
50 m2
1 outbuilding
2025-03-18
33 000 
379  /m²(87 m²)
Sale
Commercial property
87 m2
2025-03-12
217 000 
586  /m²(370 m²)
Sale
Commercial property
370 m2
942 transactions listed in the municipality

Alpes-Maritimes (06)

Most expensive cities

City
name
Descending orderHouses
house
Price per m²
14 465 
12 406 
11 667 
9 792 
8 307 
8 148 
7 867 
City
name
Descending orderApartments
apt.
Price per m²
9 214 
7 368 
7 188 
7 034 
6 009 
5 627 

Least expensive cities

City
name
Ascending orderHouses
house
Price per m²
768 
833 
833 
851 
860 
1 195 
1 196 
1 220 
1 229 
1 259 
City
name
Ascending orderApartments
apt.
Price per m²
463 
574 
651 
682 
779 
786 
800