emooki
HomePrice mapTransactions
🇬🇧 English🇫🇷 Français🇩🇪 Deutsch🇪🇸 Español🇮🇹 Italiano

Real estate price map


Real estate price map in the municipality of Malaussène.

Alpes-Maritimes (06)
Malaussène

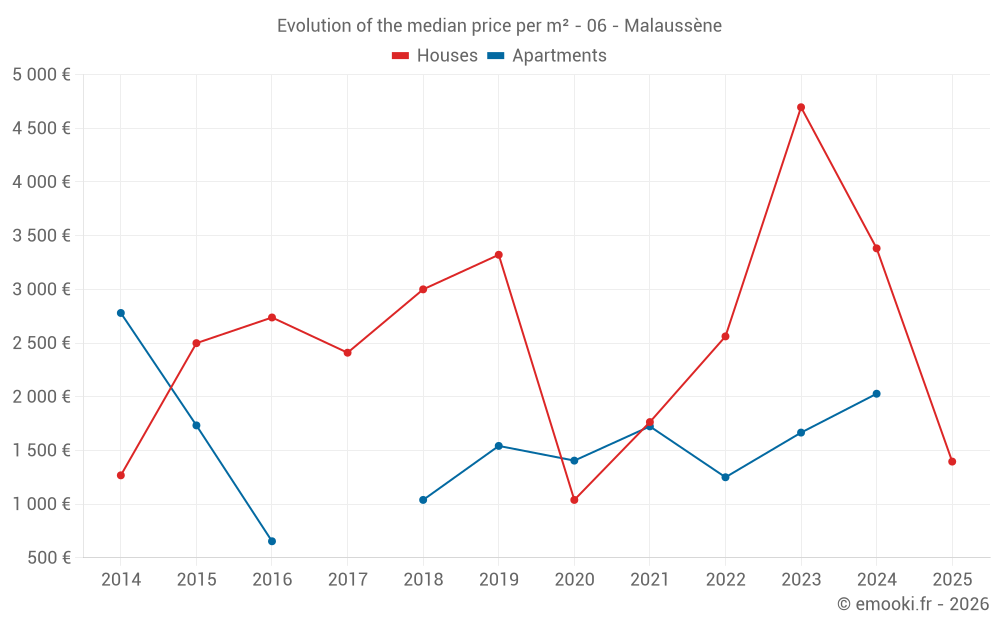
Median price of real estate
in the municipality of Malaussène

HousesHouses
2 980  /m²
1-23-45-67-89-10
Reliability 6/10
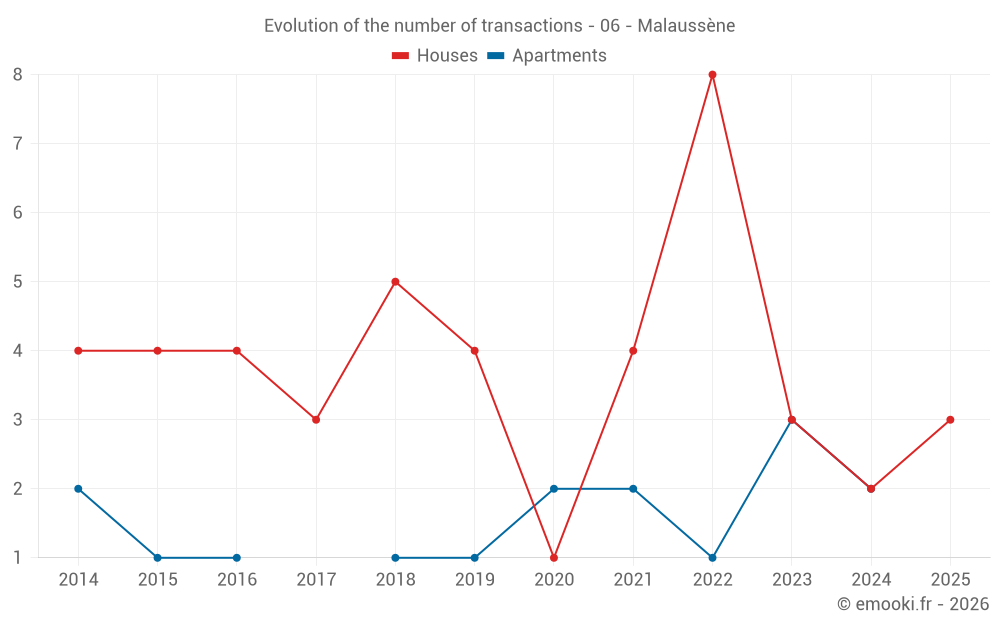
Median price on the 13 transactions of the last 36 months.
from 1 377 to
4 471  /m²
60% of transactions from the 2nd to the 8th deciles.
ApartmentsApartments
1 762  /m²
1-23-45-67-89-10
Reliability 4/10
Median price on the 8 transactions of the last 60 months.
DwellingsDwellings
2 056  /m²
1-23-45-67-89-10
Reliability 6/10
Median price on the 19 transactions of the last 36 months.
from 1 340 to
3 718  /m²
60% of transactions from the 2nd to the 8th deciles.
HousesEvolution of the price per m² of houses since...
1 year
--
2 years
--
3 years
--
4 years
--
5 years
--
6 years
--
7 years
--
8 years
--
9 years
--
10 years
--
11 years
--
ApartmentsEvolution of the price per m² of apartments since...
1 year
--
2 years
--
3 years
--
4 years
--
5 years
--
6 years
--
7 years
--
8 years
--
9 years
--
10 years
--
11 years
--

Yearly evolution

Evolution of the median price per m²

Evolution of the number of transactions

Warning, last year incomplete. Projections made based on the proportions between semesters of the previous year at the departmental/national level and by type of property.

Yearly data

Descending order
Year
Houses
house
transactions
Houses
house
Price per m²
Apartments
apt.
transactions
Apartments
apt.
Price per m²
2025
3
1 396 
0
--- 
2024
2
3 382 
2
2 028 
2023
3
4 696 
3
1 666 
2022
8
2 562 
1
1 250 
2021
4
1 764 
2
1 724 
2020
1
1 039 
2
1 405 
2019
4
3 322 
1
1 542 
2018
5
3 000 
1
1 039 
2017
3
2 410 
0
--- 
2016
4
2 738 
1
654 
2015
4
2 499 
1
1 733 
2014
4
1 268 
2
2 780 

Analysis

Structure of prices per m²

Values of price percentiles per m² over the periods used for the estimated price of each type of property.

Structure of transaction amounts

Values of transaction amounts percentiles over the periods used for the estimated price of each type of property.

Transaction amounts and prices per m² by percentile

Ascending order
Percentile
Houses
house
Price per m²
Houses
house
Transaction amount
Apartments
apt.
Price per m²
Apartments
apt.
Transaction amount
10th percentile
913 
21 600 
1 266 
41 000 
20th percentile
1 377 
63 200 
1 285 
54 000 
30th percentile
1 485 
84 800 
1 340 
60 500 
40th percentile
2 279 
129 K
1 594 
64 000 
50th percentile
2 980 
155 K
1 762 
69 500 
60th percentile
3 103 
238 K
1 897 
76 800 
70th percentile
3 718 
286 K
2 036 
86 600 
80th percentile
4 471 
333 K
2 127 
119 K
90th percentile
4 876 
369 K
2 182 
169 K

National and departmental comparison

Evolution of the median price per m² of houses

Evolution of the median price per m² of apartments

Quarterly evolution

Evolution of the median price per m²

Evolution of the number of transactions

Quarterly data

Descending order
Quarter
Houses
house
transactions
Houses
house
Price per m²
Apartments
apt.
transactions
Apartments
apt.
Price per m²
2025 Q2
1
1 396 
0
--- 
2025 Q1
2
1 232 
0
--- 
2024 Q4
2
3 382 
0
--- 
2024 Q3
0
--- 
1
1 857 
2024 Q1
0
--- 
1
2 200 
2023 Q4
0
--- 
1
1 666 
2023 Q3
1
4 696 
0
--- 
2023 Q2
0
--- 
1
2 056 
2023 Q1
2
3 950 
1
1 304 
2022 Q4
3
3 441 
0
--- 
2022 Q3
2
1 909 
1
1 250 
2022 Q2
1
2 864 
0
--- 
2022 Q1
2
1 826 
0
--- 
2021 Q4
0
--- 
1
2 174 
2021 Q3
1
1 738 
1
1 273 
2021 Q2
1
2 831 
0
--- 
2021 Q1
2
1 348 
0
--- 
2020 Q1
1
1 039 
2
1 405 
2019 Q4
0
--- 
1
1 542 
2019 Q3
1
3 962 
0
--- 
2019 Q2
2
2 366 
0
--- 
2019 Q1
1
3 628 
0
--- 
2018 Q4
1
3 492 
0
--- 
2018 Q1
4
2 662 
1
1 039 
2017 Q4
2
2 677 
0
--- 
2017 Q2
1
2 234 
0
--- 
2016 Q4
1
3 100 
0
--- 
2016 Q3
2
2 383 
0
--- 
2016 Q2
1
2 375 
1
654 
2015 Q4
1
1 132 
0
--- 
2015 Q3
2
2 499 
1
1 733 
2015 Q2
1
2 917 
0
--- 
2014 Q4
2
1 268 
0
--- 
2014 Q2
0
--- 
2
2 780 
2014 Q1
2
1 626 
0
--- 

Alpes-Maritimes (06)

Most expensive cities

City
name
Descending orderHouses
house
Price per m²
14 465 
12 406 
11 667 
9 792 
8 307 
8 148 
7 867 
City
name
Descending orderApartments
apt.
Price per m²
9 214 
7 368 
7 188 
7 034 
6 009 
5 627 

Least expensive cities

City
name
Ascending orderHouses
house
Price per m²
768 
833 
833 
851 
860 
1 195 
1 196 
1 220 
1 229 
1 259 
City
name
Ascending orderApartments
apt.
Price per m²
463 
574 
651 
682 
779 
786 
800