emooki

Real estate price map


Real estate price map in the municipality of Cap-d'Ail, choose a section to see transactions by parcel.

Alpes-Maritimes (06)

Price per m² in Cap-d'Ail

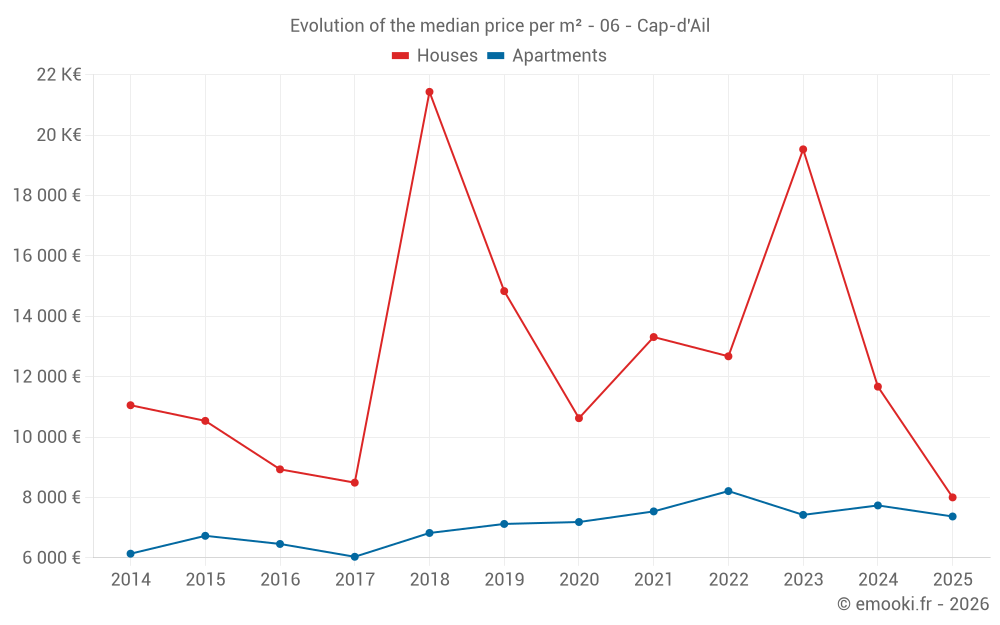
Median price of real estate
in the municipality of Cap-d'Ail

HousesHouses
11 667  /m²
1-23-45-67-89-10
Reliability 7/10
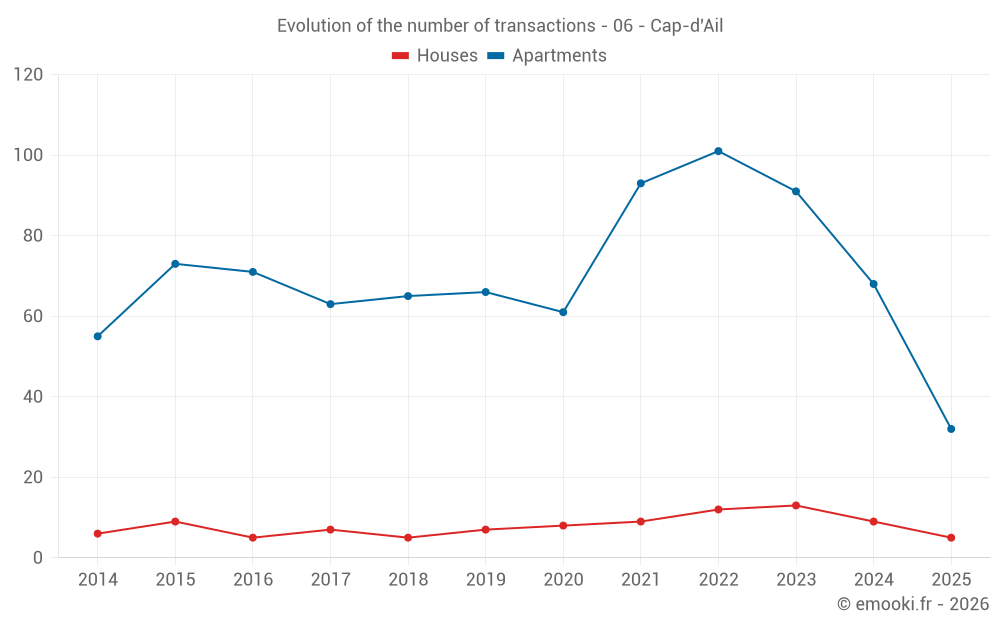
Median price on the 25 transactions of the last 24 months.
from 8 734 to
24 233  /m²
60% of transactions from the 2nd to the 8th deciles.
ApartmentsApartments
7 368  /m²
1-23-45-67-89-10
Reliability 9/10
Median price on the 32 transactions of the last 6 months.
from 5 063 to
8 883  /m²
60% of transactions from the 2nd to the 8th deciles.
DwellingsDwellings
7 500  /m²
1-23-45-67-89-10
Reliability 9/10
Median price on the 37 transactions of the last 6 months.
from 5 458 to
9 487  /m²
60% of transactions from the 2nd to the 8th deciles.
HousesEvolution of the price per m² of houses since...
1 year
-31%
2 years
-59%
3 years
-37%
4 years
-40%
5 years
-25%
6 years
-46%
7 years
-63%
8 years
-5.7%
9 years
-10%
10 years
-24%
11 years
-28%
ApartmentsEvolution of the price per m² of apartments since...
1 year
-4.7%
2 years
-0.7%
3 years
-10%
4 years
-2.2%
5 years
+2.5%
6 years
+3.5%
7 years
+8%
8 years
+22%
9 years
+14%
10 years
+10%
11 years
+20%
The price per m² of apartments has decreased by 10% since 3 years, but it has increased by 22% in 8 years.

1226 transactions listed in the municipality

Yearly data

Yearly evolution of the median price per m²

Yearly evolution of the median price per m² - 06 - Cap-d'Ail

Yearly evolution of the number of transactions

Warning, last year incomplete. Projections made based on the proportions between semesters of the previous year at the departmental/national level and by type of property.

Yearly evolution of the number of transactions - 06 - Cap-d'Ail

Yearly table

Descending order
Year
Houses
house
transactions
Houses
house
Price per m²
Apartments
apt.
transactions
Apartments
apt.
Price per m²
2025
5
8 000 
32
7 368 
2024
9
11 667 
68
7 734 
2023
13
19 525 
91
7 421 
2022
12
12 672 
101
8 209 
2021
9
13 310 
93
7 536 
2020
8
10 623 
61
7 185 
2019
7
14 831 
66
7 121 
2018
5
21 429 
65
6 822 
2017
7
8 488 
63
6 034 
2016
5
8 929 
71
6 458 
2015
9
10 534 
73
6 728 
2014
6
11 052 
55
6 136 

Analysis

Structure of prices per m²

Values of price percentiles per m² over the periods used for the estimated price of each type of property.

Structure of transaction amounts

Values of transaction amounts percentiles over the periods used for the estimated price of each type of property.

Transaction amounts and prices per m² by percentile

Ascending order
Percentile
Houses
house
Price per m²
Houses
house
Transaction amount
Apartments
apt.
Price per m²
Apartments
apt.
Transaction amount
10th percentile
6 322 
336 K
4 450 
191 K
20th percentile
8 734 
397 K
5 063 
260 K
30th percentile
9 809 
768 K
6 300 
275 K
40th percentile
10 465 
1 032 K
6 656 
310 K
50th percentile
11 667 
1 150 K
7 368 
358 K
60th percentile
17 120 
1 950 K
7 790 
391 K
70th percentile
21 376 
2 585 K
8 352 
415 K
80th percentile
24 233 
5 920 K
8 883 
550 K
90th percentile
40 311 
12 800 K
10 012 
747 K

National and departmental comparison

Evolution of the median price per m² of houses

Evolution of the median price per m² of apartments

Quarterly data

Quarterly evolution of the median price per m²

Quarterly evolution of the number of transactions

Quarterly table

Descending order
Quarter
Houses
house
transactions
Houses
house
Price per m²
Apartments
apt.
transactions
Apartments
apt.
Price per m²
2025 Q2
3
9 914 
11
6 813 
2025 Q1
2
7 125 
21
7 587 
2024 Q4
2
11 697 
24
8 857 
2024 Q3
3
11 667 
14
8 204 
2024 Q2
1
20 955 
14
6 887 
2024 Q1
3
11 059 
16
7 386 
2023 Q4
6
21 931 
20
8 129 
2023 Q3
5
10 833 
20
7 994 
2023 Q2
1
19 525 
22
7 392 
2023 Q1
1
38 462 
29
6 897 
2022 Q4
2
14 587 
28
8 132 
2022 Q3
2
9 767 
25
6 957 
2022 Q2
3
10 703 
27
8 908 
2022 Q1
5
17 164 
21
7 767 
2021 Q4
4
12 488 
18
7 940 
2021 Q3
1
39 286 
29
7 643 
2021 Q2
3
13 483 
28
7 436 
2021 Q1
1
11 047 
18
7 280 
2020 Q4
3
20 588 
11
7 000 
2020 Q3
3
10 057 
17
7 076 
2020 Q2
2
6 438 
13
9 141 
2020 Q1
0
--- 
20
7 134 
2019 Q4
2
5 810 
15
7 629 
2019 Q3
3
25 977 
14
7 608 
2019 Q2
1
8 269 
19
6 273 
2019 Q1
1
15 333 
18
7 120 
2018 Q4
3
20 833 
15
7 117 
2018 Q3
2
28 204 
20
5 964 
2018 Q2
0
--- 
14
7 896 
2018 Q1
0
--- 
16
6 930 
2017 Q4
2
14 524 
19
5 873 
2017 Q3
1
15 038 
14
6 848 
2017 Q2
2
6 370 
16
6 868 
2017 Q1
2
7 228 
14
5 784 
2016 Q4
1
8 929 
17
6 872 
2016 Q3
1
4 775 
14
7 572 
2016 Q2
0
--- 
24
6 020 
2016 Q1
3
9 733 
16
6 328 
2015 Q4
2
8 560 
18
6 114 
2015 Q3
2
57 400 
19
6 571 
2015 Q2
4
11 699 
21
7 188 
2015 Q1
1
12 970 
15
6 464 
2014 Q4
5
10 000 
11
6 944 
2014 Q3
1
22 222 
11
6 136 
2014 Q2
0
--- 
13
6 146 
2014 Q1
0
--- 
20
5 583 

Key takeaways

  • QuestionWhat is the price per m2 of houses in Cap-d'Ail?

    The median price on the 25 house transactions of the last 24 months in the municipality of Cap-d'Ail was 11 667 € per square meter for a median property value of 1 150 000 €. Over this period, 60% of transactions were between 8 734 and 24 233 € per square meter (from the 2nd to the 8th deciles).

  • QuestionWhat is the price per m2 of apartments in Cap-d'Ail?

    The median price on the 32 apartment transactions of the last 6 months in the municipality of Cap-d'Ail was 7 368 € per square meter for a median property value of 357 500 €. Over this period, 60% of transactions were between 5 063 and 8 883 € per square meter (from the 2nd to the 8th deciles).

Compare with neighboring municipalities

City
name
Descending orderHouses
house
Price per m²
Apartments
apt.
Price per m²
14 465 
7 034 
12 406 
9 214 
11 667 
7 368 
9 792 
7 188 
8 659 
6 111 
8 148 
5 238 
4 727 
3 236 
4 376 
2 329 
3 982 
4 939 
3 272 
2 143 

City information

Zip code

  • 06320 CAP D AIL