emooki
HomePrice mapTransactions
🇬🇧 English🇫🇷 Français🇩🇪 Deutsch🇪🇸 Español🇮🇹 Italiano

Real estate price map


Real estate price map in the Hautes-Pyrénées department.

Department 65
Hautes-Pyrénées

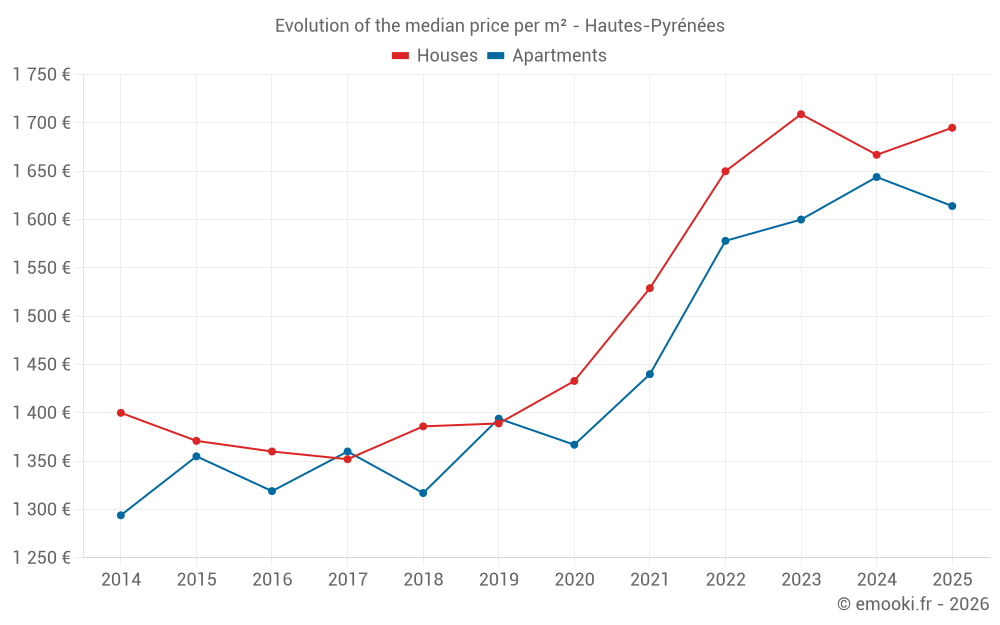
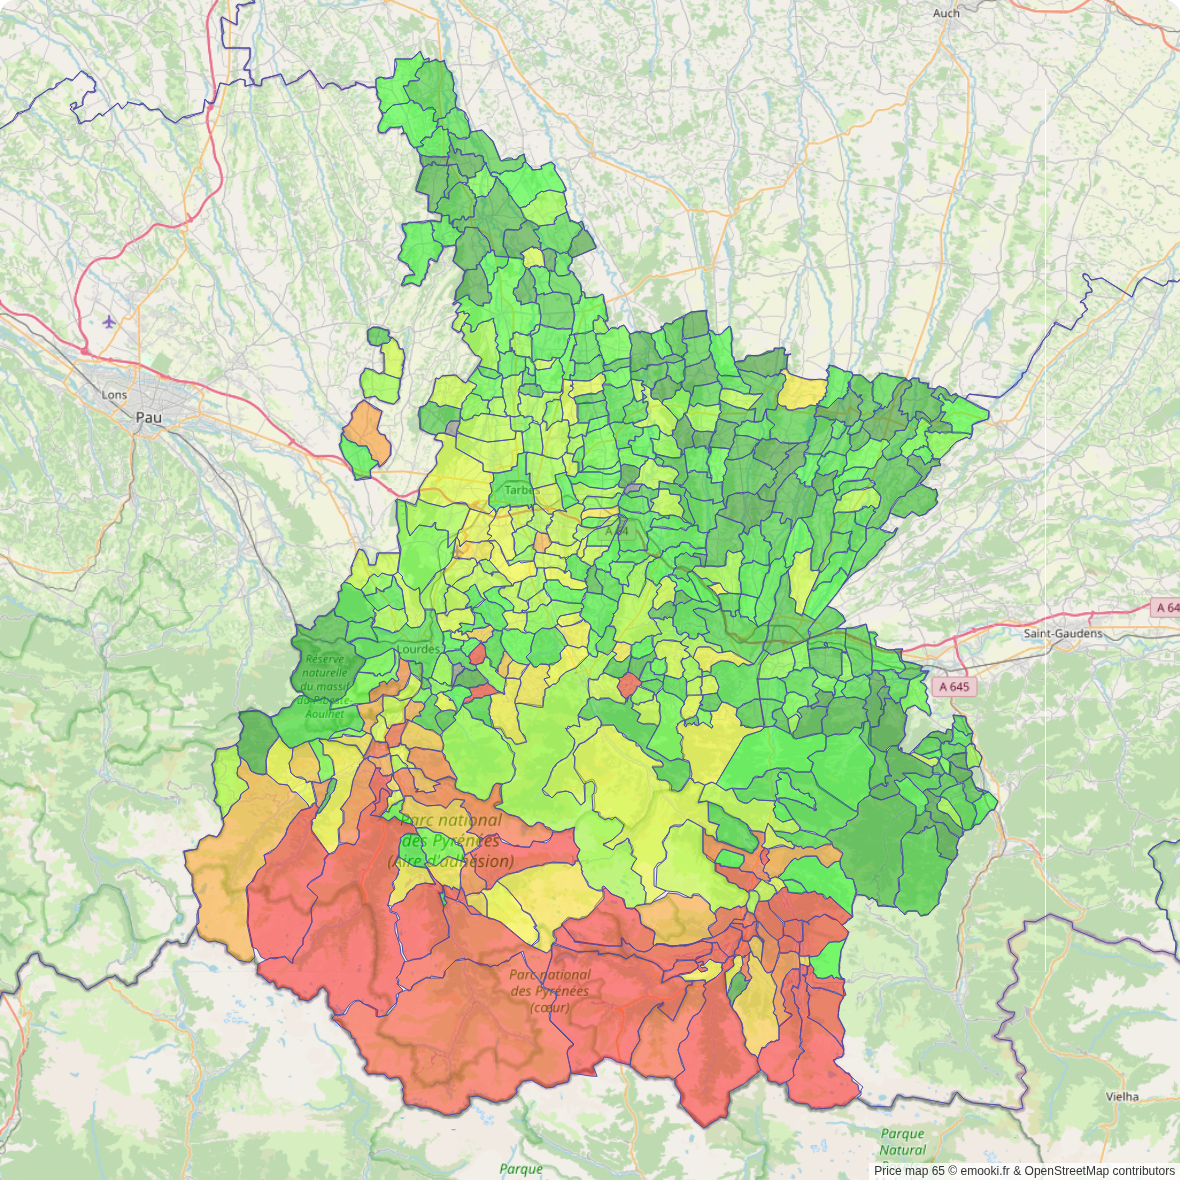
Median price of real estate
in the Hautes-Pyrénées department

HousesHouses
1 695  /m²
1-23-45-67-89-10
Reliability 10/10
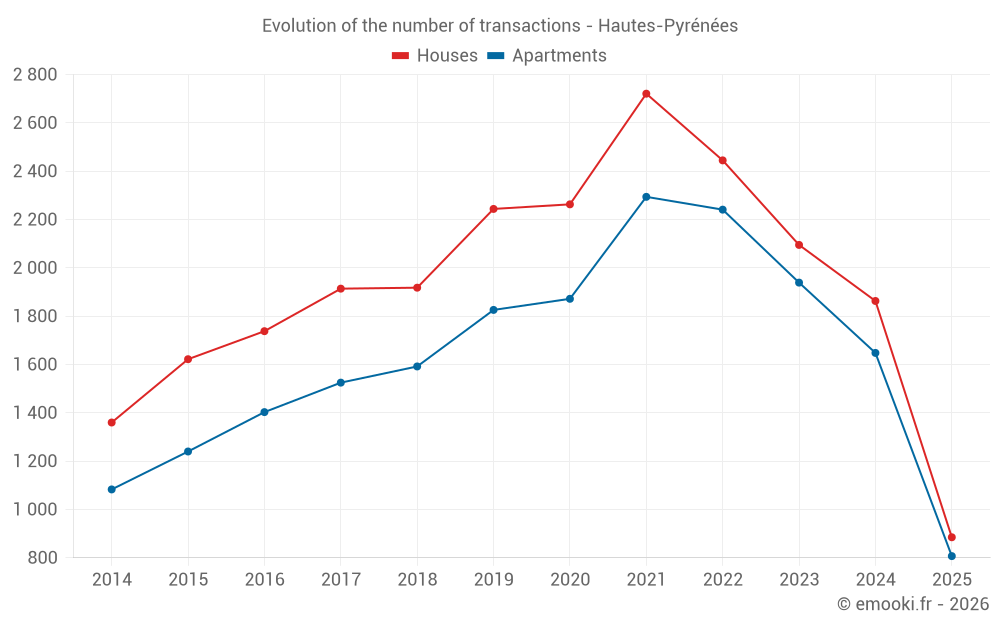
Median price on the 449 transactions of the last 3 months.
from 1 020 to
2 317  /m²
60% of transactions from the 2nd to the 8th deciles.
ApartmentsApartments
1 630  /m²
1-23-45-67-89-10
Reliability 10/10
Median price on the 409 transactions of the last 3 months.
from 1 068 to
2 703  /m²
60% of transactions from the 2nd to the 8th deciles.
DwellingsDwellings
1 669  /m²
1-23-45-67-89-10
Reliability 10/10
Median price on the 858 transactions of the last 3 months.
from 1 052 to
2 463  /m²
60% of transactions from the 2nd to the 8th deciles.
HousesEvolution of the price per m² of houses since...
1 year
+1.7%
2 years
-0.8%
3 years
+2.7%
4 years
+11%
5 years
+18%
6 years
+22%
7 years
+22%
8 years
+25%
9 years
+25%
10 years
+24%
11 years
+21%
ApartmentsEvolution of the price per m² of apartments since...
1 year
-1.8%
2 years
+0.9%
3 years
+2.3%
4 years
+12%
5 years
+18%
6 years
+16%
7 years
+23%
8 years
+19%
9 years
+22%
10 years
+19%
11 years
+25%

Yearly evolution

Evolution of the median price per m²

Evolution of the number of transactions

Warning, last year incomplete. Projections made based on the proportions between semesters of the previous year at the departmental/national level and by type of property.

Yearly data

Descending order
Year
Houses
house
transactions
Houses
house
Price per m²
Apartments
apt.
transactions
Apartments
apt.
Price per m²
2025
885
1 695 
807
1 614 
2024
1 863
1 667 
1 648
1 644 
2023
2 095
1 709 
1 939
1 600 
2022
2 445
1 650 
2 241
1 578 
2021
2 721
1 529 
2 294
1 440 
2020
2 263
1 433 
1 872
1 367 
2019
2 244
1 389 
1 826
1 394 
2018
1 918
1 386 
1 592
1 317 
2017
1 914
1 352 
1 525
1 360 
2016
1 738
1 360 
1 403
1 319 
2015
1 622
1 371 
1 240
1 355 
2014
1 360
1 400 
1 083
1 294 

Analysis

Structure of prices per m²

Values of price percentiles per m² over the periods used for the estimated price of each type of property.

Structure of transaction amounts

Values of transaction amounts percentiles over the periods used for the estimated price of each type of property.

Transaction amounts and prices per m² by percentile

Ascending order
Percentile
Houses
house
Price per m²
Houses
house
Transaction amount
Apartments
apt.
Price per m²
Apartments
apt.
Transaction amount
10th percentile
787 
78 840 
846 
43 200 
20th percentile
1 020 
113 K
1 068 
55 300 
30th percentile
1 250 
134 K
1 275 
63 442 
40th percentile
1 498 
152 K
1 455 
72 342 
50th percentile
1 695 
166 K
1 630 
83 000 
60th percentile
1 905 
185 K
1 934 
101 K
70th percentile
2 107 
210 K
2 340 
115 K
80th percentile
2 317 
232 K
2 703 
134 K
90th percentile
2 641 
285 K
3 487 
169 K

Quarterly evolution

Evolution of the median price per m²

Evolution of the number of transactions

Quarterly data

Descending order
Quarter
Houses
house
transactions
Houses
house
Price per m²
Apartments
apt.
transactions
Apartments
apt.
Price per m²
2025 Q2
449
1 695 
409
1 630 
2025 Q1
436
1 694 
398
1 606 
2024 Q4
529
1 593 
448
1 586 
2024 Q3
527
1 732 
426
1 606 
2024 Q2
454
1 620 
438
1 752 
2024 Q1
353
1 667 
336
1 614 
2023 Q4
491
1 704 
444
1 666 
2023 Q3
602
1 725 
490
1 606 
2023 Q2
521
1 719 
510
1 565 
2023 Q1
481
1 668 
495
1 587 
2022 Q4
624
1 722 
595
1 663 
2022 Q3
644
1 784 
601
1 568 
2022 Q2
635
1 614 
555
1 616 
2022 Q1
542
1 494 
490
1 470 
2021 Q4
705
1 587 
600
1 600 
2021 Q3
777
1 549 
601
1 389 
2021 Q2
682
1 480 
596
1 458 
2021 Q1
557
1 463 
497
1 317 
2020 Q4
729
1 458 
612
1 430 
2020 Q3
556
1 399 
474
1 294 
2020 Q2
503
1 438 
396
1 368 
2020 Q1
475
1 436 
390
1 362 
2019 Q4
618
1 429 
509
1 462 
2019 Q3
620
1 420 
462
1 400 
2019 Q2
524
1 354 
442
1 302 
2019 Q1
482
1 330 
413
1 414 
2018 Q4
454
1 402 
410
1 326 
2018 Q3
575
1 406 
409
1 306 
2018 Q2
463
1 412 
407
1 304 
2018 Q1
426
1 313 
366
1 327 
2017 Q4
456
1 384 
380
1 356 
2017 Q3
513
1 316 
382
1 412 
2017 Q2
519
1 358 
386
1 357 
2017 Q1
426
1 320 
377
1 319 
2016 Q4
464
1 349 
389
1 467 
2016 Q3
499
1 357 
388
1 291 
2016 Q2
450
1 424 
328
1 244 
2016 Q1
325
1 288 
298
1 248 
2015 Q4
458
1 389 
329
1 361 
2015 Q3
458
1 353 
338
1 413 
2015 Q2
369
1 345 
324
1 298 
2015 Q1
337
1 406 
249
1 331 
2014 Q4
331
1 364 
282
1 326 
2014 Q3
389
1 456 
276
1 310 
2014 Q2
329
1 427 
264
1 280 
2014 Q1
311
1 327 
261
1 237 

Hautes-Pyrénées (65)

Most expensive cities

City
name
Descending orderHouses
house
Price per m²
4 315 
3 974 
3 548 
3 375 
3 300 
3 216 
3 205 
3 119 
3 080 
City
name
Descending orderApartments
apt.
Price per m²
5 224 
3 906 
3 772 
3 380 
3 323 
3 321 
3 128 
3 116 
3 000 

Least expensive cities

City
name
Ascending orderHouses
house
Price per m²
508 
536 
566 
571 
642 
654 
674 
676 
City
name
Ascending orderApartments
apt.
Price per m²
76 
224 
333 
341 
370 
462 
500 
502