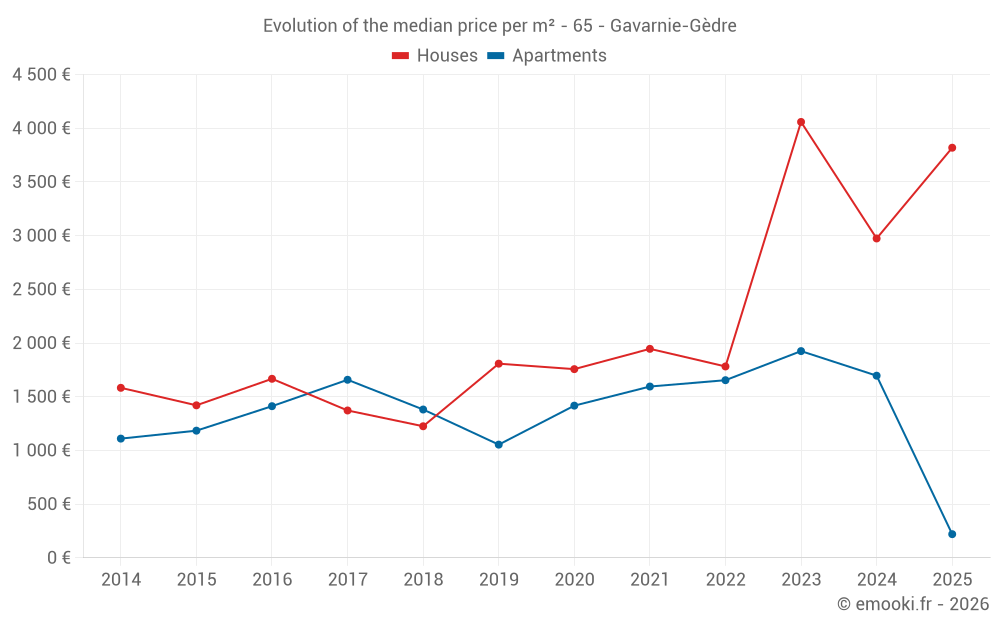
Median price of real estate
in the municipality of Gavarnie-Gèdre
Houses
2 564 € /m²
Reliability 5/10
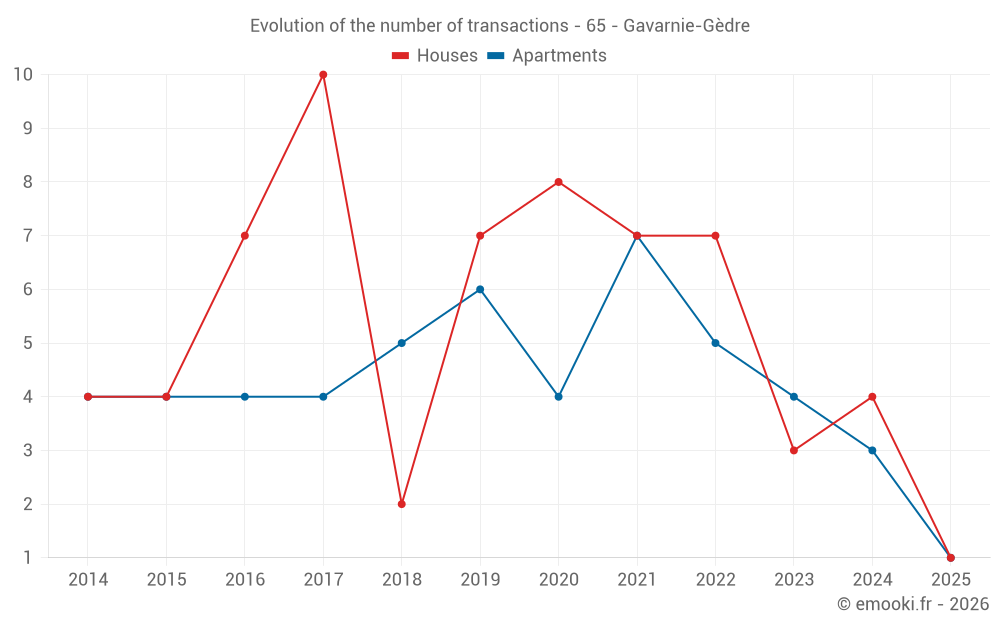
Median price on the 18 transactions of the last 48 months.
from 1 575 to
3 775 € /m²
3 775 € /m²
60% of transactions from the 2nd to the 8th deciles.
Apartments
1 624 € /m²
Reliability 5/10
Median price on the 18 transactions of the last 48 months.
from 890 to
2 260 € /m²
2 260 € /m²
60% of transactions from the 2nd to the 8th deciles.
Dwellings
2 564 € /m²
Reliability 7/10
Median price on the 15 transactions of the last 24 months.
from 1 557 to
3 867 € /m²
3 867 € /m²
60% of transactions from the 2nd to the 8th deciles.