emooki
HomePrice mapTransactions
🇬🇧 English🇫🇷 Français🇩🇪 Deutsch🇪🇸 Español🇮🇹 Italiano

Real estate price map


Real estate price map in the municipality of Maubourguet, choose a section to see transactions by parcel.

Hautes-Pyrénées (65)

Maubourguet - Real estate price m²

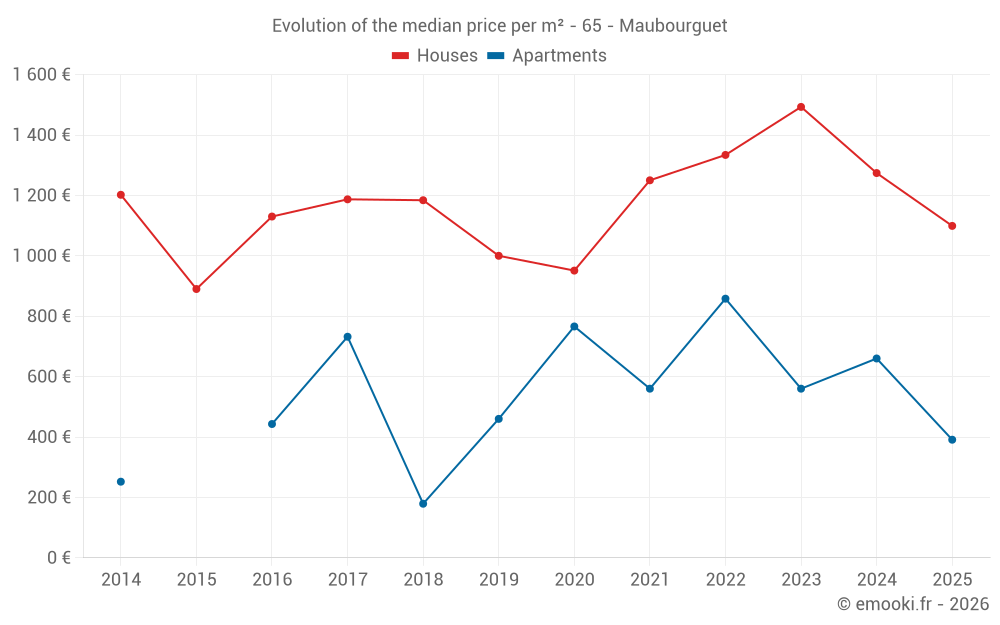
Median price of real estate
in the municipality of Maubourguet

HousesHouses
1 250  /m²
1-23-45-67-89-10
Reliability 8/10
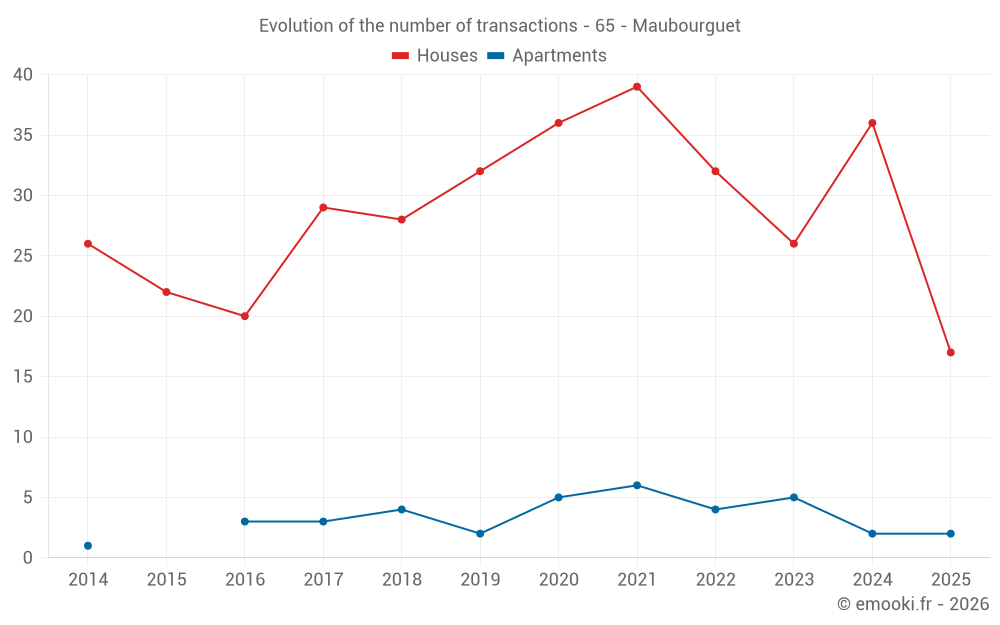
Median price on the 37 transactions of the last 12 months.
from 847 to
1 728  /m²
60% of transactions from the 2nd to the 8th deciles.
ApartmentsApartments
734  /m²
1-23-45-67-89-10
Reliability 5/10
Median price on the 18 transactions of the last 48 months.
from 345 to
955  /m²
60% of transactions from the 2nd to the 8th deciles.
DwellingsDwellings
1 000  /m²
1-23-45-67-89-10
Reliability 9/10
Median price on the 19 transactions of the last 6 months.
from 763 to
1 834  /m²
60% of transactions from the 2nd to the 8th deciles.
HousesEvolution of the price per m² of houses since...
1 year
-14%
2 years
-26%
3 years
-18%
4 years
-12%
5 years
+16%
6 years
+10%
7 years
-7.2%
8 years
-7.4%
9 years
-2.7%
10 years
+23%
11 years
-8.6%
The price per m² of houses has decreased by 26% since 2 years, but it has increased by 23% in 10 years.

Yearly evolution

Evolution of the median price per m²

Evolution of the median price per m² - 65 - Maubourguet

Evolution of the number of transactions

Warning, last year incomplete. Projections made based on the proportions between semesters of the previous year at the departmental/national level and by type of property.

Evolution of the number of transactions - 65 - Maubourguet

Yearly data

Descending order
Year
Houses
house
transactions
Houses
house
Price per m²
Apartments
apt.
transactions
Apartments
apt.
Price per m²
2025
17
1 099 
2
391 
2024
36
1 274 
2
660 
2023
26
1 493 
5
560 
2022
32
1 334 
4
858 
2021
39
1 250 
6
560 
2020
36
951 
5
766 
2019
32
1 000 
2
460 
2018
28
1 184 
4
179 
2017
29
1 187 
3
732 
2016
20
1 130 
3
443 
2015
22
890 
0
--- 
2014
26
1 202 
1
252 

Analysis

Structure of prices per m²

Values of price percentiles per m² over the periods used for the estimated price of each type of property.

Structure of transaction amounts

Values of transaction amounts percentiles over the periods used for the estimated price of each type of property.

Transaction amounts and prices per m² by percentile

Ascending order
Percentile
Houses
house
Price per m²
Houses
house
Transaction amount
Apartments
apt.
Price per m²
Apartments
apt.
Transaction amount
10th percentile
710 
66 200 
288 
44 833 
20th percentile
847 
74 000 
345 
60 800 
30th percentile
997 
104 K
530 
71 965 
40th percentile
1 086 
117 K
674 
97 130 
50th percentile
1 250 
128 K
734 
132 K
60th percentile
1 296 
140 K
803 
144 K
70th percentile
1 602 
160 K
890 
158 K
80th percentile
1 728 
173 K
955 
161 K
90th percentile
1 921 
194 K
1 061 
225 K

National and departmental comparison

Evolution of the median price per m² of houses

Evolution of the median price per m² of apartments

Quarterly evolution

Evolution of the median price per m²

Evolution of the number of transactions

Quarterly data

Descending order
Quarter
Houses
house
transactions
Houses
house
Price per m²
Apartments
apt.
transactions
Apartments
apt.
Price per m²
2025 Q2
4
943 
0
--- 
2025 Q1
13
1 303 
2
391 
2024 Q4
11
1 273 
1
899 
2024 Q3
9
1 250 
1
420 
2024 Q2
10
1 190 
0
--- 
2024 Q1
6
1 786 
0
--- 
2023 Q4
5
1 414 
2
410 
2023 Q3
8
1 917 
1
560 
2023 Q2
7
1 520 
0
--- 
2023 Q1
6
1 025 
2
939 
2022 Q4
5
1 208 
1
914 
2022 Q3
8
1 996 
0
--- 
2022 Q2
9
1 381 
0
--- 
2022 Q1
10
1 123 
3
803 
2021 Q4
8
1 838 
2
676 
2021 Q3
8
1 190 
3
706 
2021 Q2
11
909 
0
--- 
2021 Q1
12
1 338 
1
415 
2020 Q4
8
1 169 
3
679 
2020 Q3
15
955 
0
--- 
2020 Q2
8
746 
2
778 
2020 Q1
5
1 205 
0
--- 
2019 Q4
3
733 
0
--- 
2019 Q3
9
840 
1
761 
2019 Q2
8
1 036 
1
159 
2019 Q1
12
1 172 
0
--- 
2018 Q4
4
1 228 
2
564 
2018 Q3
10
1 274 
1
56 
2018 Q2
5
833 
0
--- 
2018 Q1
9
1 289 
1
250 
2017 Q4
11
967 
0
--- 
2017 Q3
9
1 187 
2
666 
2017 Q2
4
1 308 
1
842 
2017 Q1
5
1 222 
0
--- 
2016 Q4
8
1 052 
1
443 
2016 Q3
4
1 586 
1
455 
2016 Q2
2
956 
1
426 
2016 Q1
6
1 149 
0
--- 
2015 Q4
3
915 
0
--- 
2015 Q3
7
1 146 
0
--- 
2015 Q2
3
1 556 
0
--- 
2015 Q1
9
851 
0
--- 
2014 Q4
12
1 140 
0
--- 
2014 Q3
2
1 225 
0
--- 
2014 Q2
5
1 090 
1
252 
2014 Q1
7
1 313 
0
--- 

Overview of the latest real estate transactions

The following list is an anonymized overview of the latest transactions. For more details and to find all transactions, please use the map to view transactions by plot or the transaction search page for a search by criteria.

2025-05-07
3 500 
Sale
Land
5660 m2
-Futaies résineuses
/Sapins ou sapinière
2025-05-05
140 700 
1 099  /m²(128 m²)
Sale
Houses
House
5 rooms
128 m2
Land
194 m2
-Sols
2025-04-30
70 000 
787  /m²(89 m²)
Sale
Houses
House
4 rooms
89 m2
Land
1000 m2
-Sols
2025-04-30
110 000 
764  /m²(144 m²)
Sale
Houses
House
5 rooms
144 m2
Land
1464 m2
-Sols
2025-04-25
3 000 
Sale
Land
290 m2
-Sols
2025-04-15
120 000 
889  /m²(135 m²)
2 667  /m²(45 m²)
Sale
Land
116 m2
-Sols
Houses
House
4 rooms
45 m2
Commercial property
90 m2
Land
736 m2
-Sols
Land
515 m2
-Jardins
/Jardin potager
2025-04-14
31 000 
Sale
Land
1536 m2
-Terres
2025-04-04
117 500 
1 836  /m²(64 m²)
Sale
Houses
House
4 rooms
64 m2
1 outbuilding
Land
780 m2
-Sols
Land
1247 m2
-Sols
2025-04-03
8 000 
Sale
Land
5520 m2
-Terres
Land
5620 m2
-Terres
2025-03-27
116 000 
1 303  /m²(89 m²)
Sale
Houses
House
4 rooms
89 m2
Land
285 m2
-Sols
2025-03-26
1 000 
Sale
Land
5167 m2
-Taillis simples
Land
4283 m2
-Terres
2025-03-22
36 025 
Sale
Land
22220 m2
-Terres
Land
6600 m2
-Terres
2025-03-20
146 721 
Sale
Land
27227 m2
-Terres
Land
19710 m2
-Terres
Land
1438 m2
-Terres
Land
1830 m2
-Terres
Land
10652 m2
-Terres
Land
3861 m2
-Terres
Land
3460 m2
-Terres
Land
5970 m2
-Terres
Land
36664 m2
-Terres
Land
2050 m2
-Terres
2025-03-12
124 700 
1 521  /m²(82 m²)
Sale
Houses
House
3 rooms
82 m2
Land
748 m2
-Sols
2025-03-10
99 000 
762  /m²(130 m²)
Sale
Apartments
Apartment
3 rooms
65 m2
Apartments
Apartment
3 rooms
65 m2
Land
1293 m2
-Sols
2025-03-07
165 000 
1 833  /m²(90 m²)
Sale
Houses
House
4 rooms
90 m2
1 outbuilding
Land
466 m2
-Sols
Land
134 m2
-Sols
2025-03-06
90 000 
629  /m²(143 m²)
Sale
Houses
House
4 rooms
143 m2
Land
491 m2
-Sols
2025-03-06
160 000 
2 051  /m²(78 m²)
Sale
Houses
House
4 rooms
78 m2
Land
914 m2
-Sols
2025-02-22
3 000 
20  /m²(148 m²)
Sale
Apartments
Apartment
3 rooms
65 m2
Apartments
Apartment
2 rooms
55 m2
Apartments
Apartment
1 room
28 m2
1 outbuilding
Land
110 m2
-Sols
2025-02-19
202 000 
1 980  /m²(102 m²)
Sale
Houses
House
5 rooms
102 m2
Land
2326 m2
-Sols
Land
148 m2
-Terres
623 transactions listed in the municipality

Hautes-Pyrénées (65)

Most expensive cities

City
name
Descending orderHouses
house
Price per m²
4 315 
3 974 
3 548 
3 375 
3 300 
3 216 
3 205 
3 119 
3 080 
City
name
Descending orderApartments
apt.
Price per m²
5 224 
3 906 
3 772 
3 380 
3 323 
3 321 
3 128 
3 116 
3 000 

Least expensive cities

City
name
Ascending orderHouses
house
Price per m²
508 
536 
566 
571 
642 
654 
674 
676 
City
name
Ascending orderApartments
apt.
Price per m²
76 
224 
333 
341 
370 
462 
500 
502