emooki
HomePrice mapTransactions
🇬🇧 English🇫🇷 Français🇩🇪 Deutsch🇪🇸 Español🇮🇹 Italiano

Real estate price map


Real estate price map in the municipality of Soues, choose a section to see transactions by parcel.

Hautes-Pyrénées (65)

Soues - Real estate price m²

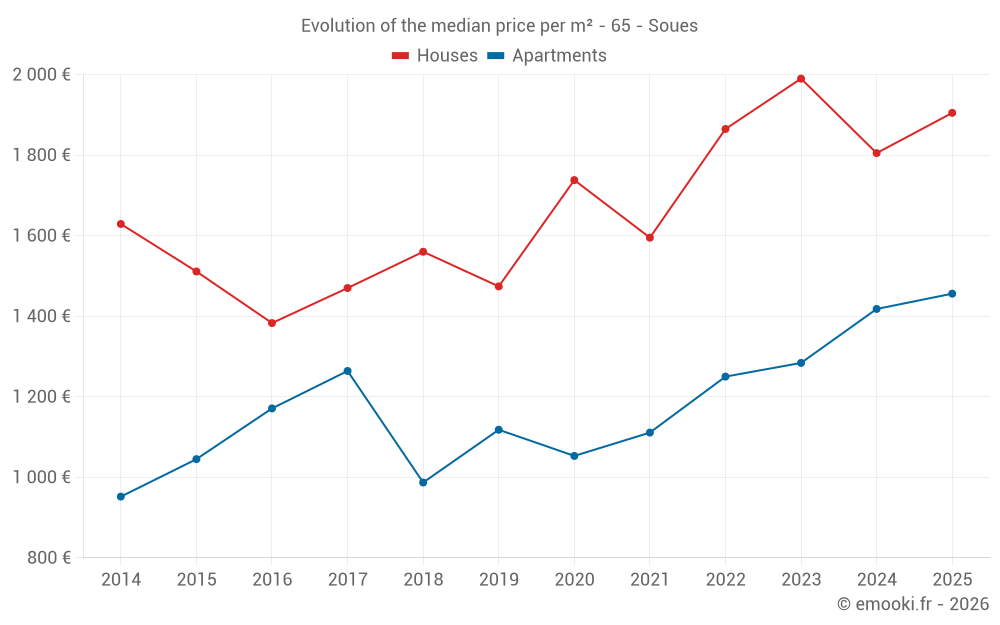
Median price of real estate
in the municipality of Soues

HousesHouses
1 913  /m²
1-23-45-67-89-10
Reliability 8/10
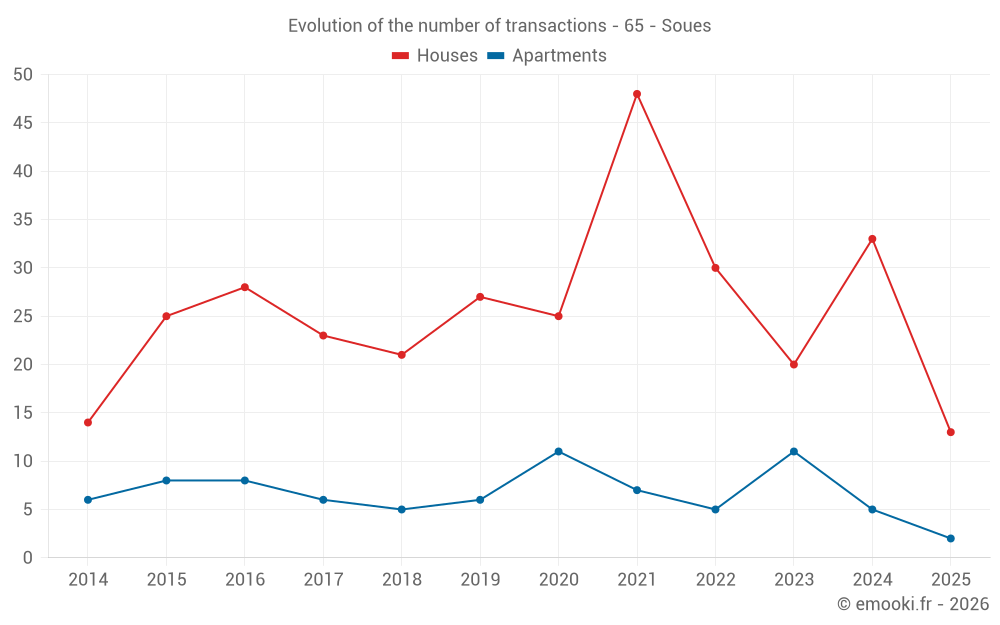
Median price on the 33 transactions of the last 12 months.
from 1 533 to
2 443  /m²
60% of transactions from the 2nd to the 8th deciles.
ApartmentsApartments
1 317  /m²
1-23-45-67-89-10
Reliability 7/10
Median price on the 16 transactions of the last 24 months.
from 1 138 to
1 522  /m²
60% of transactions from the 2nd to the 8th deciles.
DwellingsDwellings
1 800  /m²
1-23-45-67-89-10
Reliability 8/10
Median price on the 38 transactions of the last 12 months.
from 1 415 to
2 356  /m²
60% of transactions from the 2nd to the 8th deciles.
HousesEvolution of the price per m² of houses since...
1 year
+5.5%
2 years
-4.3%
3 years
+2.1%
4 years
+19%
5 years
+10%
6 years
+29%
7 years
+22%
8 years
+30%
9 years
+38%
10 years
+26%
11 years
+17%
The price per m² of houses has decreased by 4.3% since 2 years, but it has increased by 38% in 9 years.

Yearly evolution

Evolution of the median price per m²

Evolution of the median price per m² - 65 - Soues

Evolution of the number of transactions

Warning, last year incomplete. Projections made based on the proportions between semesters of the previous year at the departmental/national level and by type of property.

Evolution of the number of transactions - 65 - Soues

Yearly data

Descending order
Year
Houses
house
transactions
Houses
house
Price per m²
Apartments
apt.
transactions
Apartments
apt.
Price per m²
2025
13
1 905 
2
1 456 
2024
33
1 805 
5
1 418 
2023
20
1 990 
11
1 284 
2022
30
1 865 
5
1 250 
2021
48
1 595 
7
1 111 
2020
25
1 738 
11
1 053 
2019
27
1 474 
6
1 118 
2018
21
1 560 
5
987 
2017
23
1 470 
6
1 264 
2016
28
1 383 
8
1 171 
2015
25
1 511 
8
1 045 
2014
14
1 629 
6
952 

Analysis

Structure of prices per m²

Values of price percentiles per m² over the periods used for the estimated price of each type of property.

Structure of transaction amounts

Values of transaction amounts percentiles over the periods used for the estimated price of each type of property.

Transaction amounts and prices per m² by percentile

Ascending order
Percentile
Houses
house
Price per m²
Houses
house
Transaction amount
Apartments
apt.
Price per m²
Apartments
apt.
Transaction amount
10th percentile
1 202 
124 K
1 104 
80 654 
20th percentile
1 533 
137 K
1 138 
82 000 
30th percentile
1 708 
146 K
1 204 
86 000 
40th percentile
1 794 
158 K
1 232 
89 070 
50th percentile
1 913 
180 K
1 317 
107 K
60th percentile
2 134 
192 K
1 418 
112 K
70th percentile
2 199 
203 K
1 492 
117 K
80th percentile
2 443 
224 K
1 522 
123 K
90th percentile
2 842 
244 K
1 600 
130 K

National and departmental comparison

Evolution of the median price per m² of houses

Evolution of the median price per m² of apartments

Quarterly evolution

Evolution of the median price per m²

Evolution of the number of transactions

Quarterly data

Descending order
Quarter
Houses
house
transactions
Houses
house
Price per m²
Apartments
apt.
transactions
Apartments
apt.
Price per m²
2025 Q2
9
1 905 
2
1 456 
2025 Q1
4
1 902 
0
--- 
2024 Q4
9
1 794 
2
1 532 
2024 Q3
11
2 286 
1
1 089 
2024 Q2
6
1 508 
2
1 306 
2024 Q1
7
1 829 
0
--- 
2023 Q4
6
2 127 
2
1 272 
2023 Q3
6
2 276 
7
1 284 
2023 Q2
4
2 026 
1
1 090 
2023 Q1
4
1 275 
1
1 296 
2022 Q4
10
1 796 
2
1 380 
2022 Q3
6
1 752 
2
1 020 
2022 Q2
9
1 845 
1
1 394 
2022 Q1
5
2 292 
0
--- 
2021 Q4
13
1 667 
0
--- 
2021 Q3
12
1 595 
0
--- 
2021 Q2
14
1 699 
3
1 470 
2021 Q1
9
1 386 
4
1 001 
2020 Q4
9
2 063 
3
1 000 
2020 Q3
8
1 714 
4
976 
2020 Q2
3
1 786 
4
1 220 
2020 Q1
5
1 436 
0
--- 
2019 Q4
10
1 452 
0
--- 
2019 Q3
7
1 474 
3
1 118 
2019 Q2
4
1 663 
1
930 
2019 Q1
6
1 578 
2
1 165 
2018 Q4
7
1 808 
1
941 
2018 Q3
5
1 560 
0
--- 
2018 Q2
6
1 472 
1
987 
2018 Q1
3
1 350 
3
1 188 
2017 Q4
5
1 495 
2
1 404 
2017 Q3
9
1 748 
1
1 037 
2017 Q2
4
1 284 
0
--- 
2017 Q1
5
1 327 
3
1 260 
2016 Q4
7
1 439 
1
1 171 
2016 Q3
11
1 353 
4
1 219 
2016 Q2
6
1 410 
1
1 139 
2016 Q1
4
1 216 
2
860 
2015 Q4
5
1 446 
1
979 
2015 Q3
14
1 503 
3
1 035 
2015 Q2
3
1 774 
3
1 045 
2015 Q1
3
1 711 
1
1 092 
2014 Q4
5
1 433 
0
--- 
2014 Q3
5
1 651 
2
974 
2014 Q2
1
788 
2
1 184 
2014 Q1
3
1 897 
2
952 

Overview of the latest real estate transactions

The following list is an anonymized overview of the latest transactions. For more details and to find all transactions, please use the map to view transactions by plot or the transaction search page for a search by criteria.

2025-06-20
167 890 
2 469  /m²(68 m²)
Sale
Houses
House
4 rooms
68 m2
1 outbuilding
Land
455 m2
-Sols
2025-06-19
121 982 
1 525  /m²(80 m²)
Sale
Houses
House
3 rooms
80 m2
1 outbuilding
Land
134 m2
-Sols
2025-06-06
199 100 
2 212  /m²(90 m²)
Sale
Houses
House
5 rooms
90 m2
1 outbuilding
Land
469 m2
-Sols
2025-06-06
152 425 
1 793  /m²(85 m²)
Sale
Houses
House
3 rooms
85 m2
Land
574 m2
-Sols
2025-06-05
65 000 
transaction.nature.Vente terrain à bâtir
Land
609 m2
-Terrains à bâtir
2025-06-02
138 000 
1 725  /m²(80 m²)
Sale
Houses
House
3 rooms
80 m2
Land
481 m2
-Sols
2025-05-28
195 000 
2 191  /m²(89 m²)
Sale
Houses
House
3 rooms
89 m2
Land
614 m2
-Sols
2025-05-26
129 200 
1 700  /m²(76 m²)
Sale
Apartments
Apartment
3 rooms
76 m2
1 outbuilding
2025-05-20
117 700 
1 213  /m²(97 m²)
Sale
Apartments
Apartment
4 rooms
97 m2
1 outbuilding
2025-05-20
180 000 
1 295  /m²(139 m²)
Sale
Houses
House
6 rooms
139 m2
Land
800 m2
-Sols
Land
821 m2
-Prés
2025-05-14
120 000 
1 905  /m²(63 m²)
Sale
Houses
House
4 rooms
63 m2
1 outbuilding
Land
677 m2
-Sols
Land
126 m2
-Terres
2025-04-17
4 754 
Sale
Land
1119 m2
-Landes
/Pâture plantée
Land
1198 m2
-Landes
/Pâture plantée
Land
918 m2
-Landes
Land
1254 m2
-Landes
Land
728 m2
-Landes
2025-04-15
141 255 
2 140  /m²(66 m²)
Sale
Houses
House
4 rooms
66 m2
1 outbuilding
Land
650 m2
-Sols
2025-03-31
180 000 
1 364  /m²(132 m²)
Sale
Commercial property
132 m2
2025-02-18
12 600 
Sale
Land
243 m2
-Sols
Land
704 m2
-Terrains à bâtir
2025-02-07
147 030 
1 671  /m²(88 m²)
Sale
Houses
House
4 rooms
88 m2
2 outbuildings
2025-01-30
130 000 
1 413  /m²(92 m²)
Sale
Houses
House
5 rooms
92 m2
Land
524 m2
-Sols
2025-01-23
145 650 
2 142  /m²(68 m²)
Sale
Houses
House
3 rooms
68 m2
Land
511 m2
-Sols
2025-01-09
198 400 
2 133  /m²(93 m²)
Sale
Houses
House
5 rooms
93 m2
Land
247 m2
-Sols
2024-12-24
191 326 
1 913  /m²(100 m²)
Sale
Houses
House
4 rooms
100 m2
Land
236 m2
-Sols
Land
243 m2
-Jardins
529 transactions listed in the municipality

Hautes-Pyrénées (65)

Most expensive cities

City
name
Descending orderHouses
house
Price per m²
4 315 
3 974 
3 548 
3 375 
3 300 
3 216 
3 205 
3 119 
3 080 
City
name
Descending orderApartments
apt.
Price per m²
5 224 
3 906 
3 772 
3 380 
3 323 
3 321 
3 128 
3 116 
3 000 

Least expensive cities

City
name
Ascending orderHouses
house
Price per m²
508 
536 
566 
571 
642 
654 
674 
676 
City
name
Ascending orderApartments
apt.
Price per m²
76 
224 
333 
341 
370 
462 
500 
502