emooki
HomePrice mapTransactions
🇬🇧 English🇫🇷 Français🇩🇪 Deutsch🇪🇸 Español🇮🇹 Italiano

Real estate price map


Real estate price map in the municipality of Vic-en-Bigorre, choose a section to see transactions by parcel.

Hautes-Pyrénées (65)

Vic-en-Bigorre - Real estate price m²

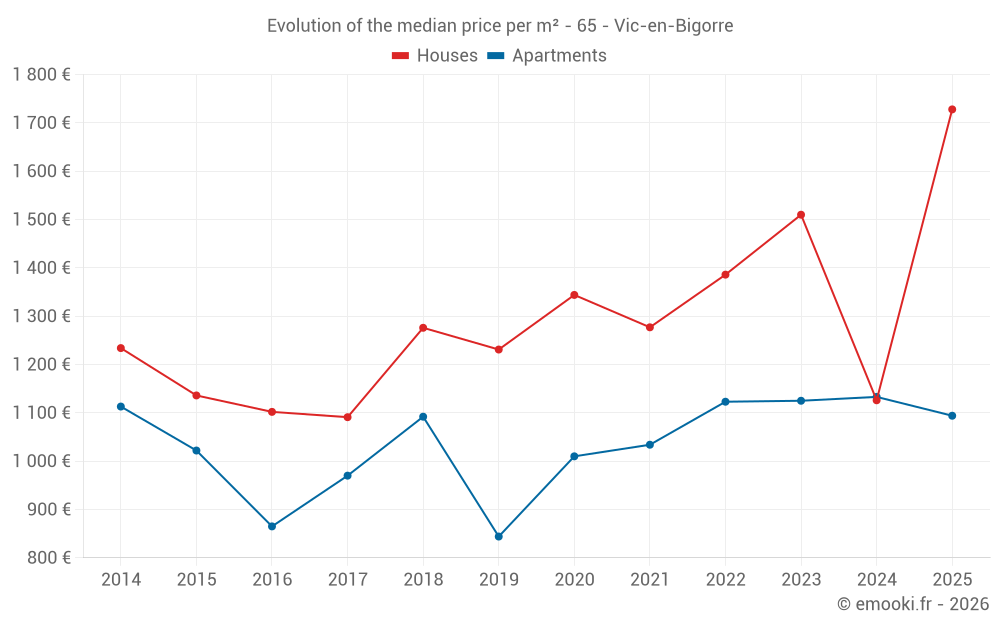
Median price of real estate
in the municipality of Vic-en-Bigorre

HousesHouses
1 728  /m²
1-23-45-67-89-10
Reliability 9/10
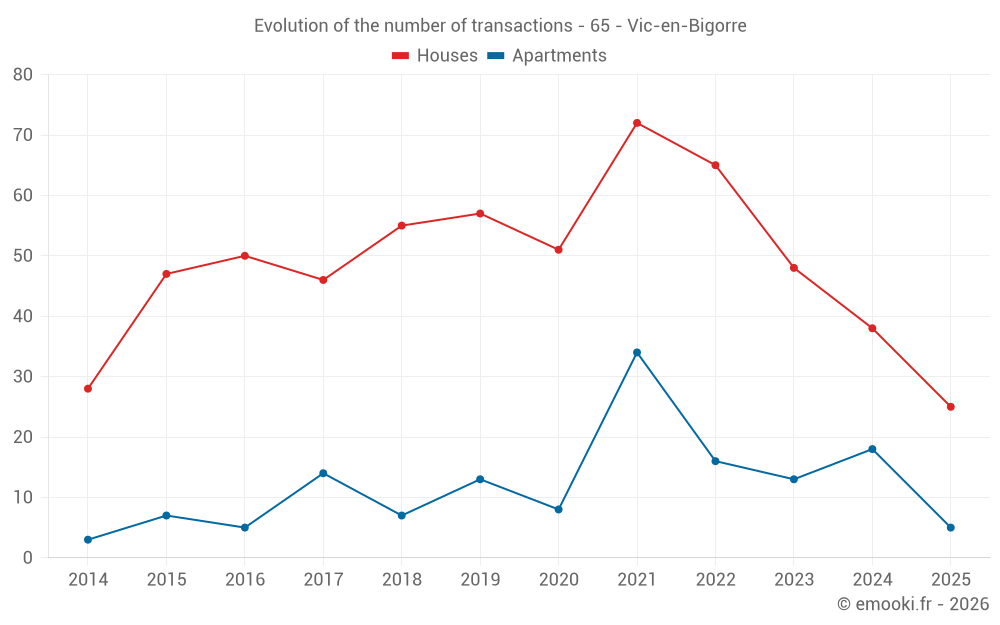
Median price on the 25 transactions of the last 6 months.
from 1 016 to
2 132  /m²
60% of transactions from the 2nd to the 8th deciles.
ApartmentsApartments
1 125  /m²
1-23-45-67-89-10
Reliability 8/10
Median price on the 17 transactions of the last 12 months.
from 1 056 to
1 381  /m²
60% of transactions from the 2nd to the 8th deciles.
DwellingsDwellings
1 508  /m²
1-23-45-67-89-10
Reliability 9/10
Median price on the 30 transactions of the last 6 months.
from 1 037 to
2 080  /m²
60% of transactions from the 2nd to the 8th deciles.
HousesEvolution of the price per m² of houses since...
1 year
+53%
2 years
+14%
3 years
+25%
4 years
+35%
5 years
+29%
6 years
+40%
7 years
+35%
8 years
+58%
9 years
+57%
10 years
+52%
11 years
+40%
ApartmentsEvolution of the price per m² of apartments since...
1 year
-3.4%
2 years
-2.8%
3 years
-2.6%
4 years
+5.8%
5 years
+8.3%
6 years
+30%
7 years
+0.2%
8 years
+13%
9 years
+26%
10 years
+7%
11 years
--
The price per m² of apartments has decreased by 3.4% since 1 year, but it has increased by 30% in 6 years.

Yearly evolution

Evolution of the median price per m²

Evolution of the median price per m² - 65 - Vic-en-Bigorre

Evolution of the number of transactions

Warning, last year incomplete. Projections made based on the proportions between semesters of the previous year at the departmental/national level and by type of property.

Evolution of the number of transactions - 65 - Vic-en-Bigorre

Yearly data

Descending order
Year
Houses
house
transactions
Houses
house
Price per m²
Apartments
apt.
transactions
Apartments
apt.
Price per m²
2025
25
1 728 
5
1 094 
2024
38
1 126 
18
1 133 
2023
48
1 510 
13
1 125 
2022
65
1 386 
16
1 123 
2021
72
1 277 
34
1 034 
2020
51
1 344 
8
1 010 
2019
57
1 231 
13
844 
2018
55
1 276 
7
1 092 
2017
46
1 091 
14
970 
2016
50
1 102 
5
865 
2015
47
1 136 
7
1 022 
2014
28
1 234 
3
1 113 

Analysis

Structure of prices per m²

Values of price percentiles per m² over the periods used for the estimated price of each type of property.

Structure of transaction amounts

Values of transaction amounts percentiles over the periods used for the estimated price of each type of property.

Transaction amounts and prices per m² by percentile

Ascending order
Percentile
Houses
house
Price per m²
Houses
house
Transaction amount
Apartments
apt.
Price per m²
Apartments
apt.
Transaction amount
10th percentile
816 
79 000 
967 
53 560 
20th percentile
1 016 
97 000 
1 056 
59 500 
30th percentile
1 247 
111 K
1 087 
67 500 
40th percentile
1 511 
128 K
1 099 
69 400 
50th percentile
1 728 
142 K
1 125 
72 000 
60th percentile
1 863 
161 K
1 190 
79 540 
70th percentile
1 963 
184 K
1 320 
86 800 
80th percentile
2 132 
212 K
1 381 
104 K
90th percentile
2 351 
230 K
1 406 
121 K

National and departmental comparison

Evolution of the median price per m² of houses

Evolution of the median price per m² of apartments

Quarterly evolution

Evolution of the median price per m²

Evolution of the number of transactions

Quarterly data

Descending order
Quarter
Houses
house
transactions
Houses
house
Price per m²
Apartments
apt.
transactions
Apartments
apt.
Price per m²
2025 Q2
9
1 498 
4
1 140 
2025 Q1
16
1 742 
1
1 094 
2024 Q4
11
1 094 
8
1 116 
2024 Q3
15
1 320 
4
1 396 
2024 Q2
6
1 447 
3
979 
2024 Q1
6
1 018 
3
1 219 
2023 Q4
12
1 114 
3
1 250 
2023 Q3
13
1 907 
6
1 188 
2023 Q2
13
1 488 
3
491 
2023 Q1
10
1 482 
1
1 365 
2022 Q4
19
1 202 
3
1 191 
2022 Q3
17
1 530 
5
1 143 
2022 Q2
18
1 508 
3
1 125 
2022 Q1
11
1 015 
5
1 047 
2021 Q4
19
1 481 
8
1 077 
2021 Q3
16
1 116 
10
1 083 
2021 Q2
23
1 145 
11
1 008 
2021 Q1
14
1 430 
5
891 
2020 Q4
20
1 402 
3
1 021 
2020 Q3
14
1 206 
1
1 084 
2020 Q2
7
1 308 
0
--- 
2020 Q1
10
1 286 
4
749 
2019 Q4
19
1 127 
4
654 
2019 Q3
14
1 355 
4
930 
2019 Q2
13
1 252 
2
1 160 
2019 Q1
11
1 126 
3
844 
2018 Q4
13
1 286 
2
860 
2018 Q3
19
1 308 
2
1 001 
2018 Q2
10
1 129 
2
1 079 
2018 Q1
13
1 276 
1
1 092 
2017 Q4
11
1 196 
5
1 000 
2017 Q3
13
1 237 
1
1 194 
2017 Q2
11
946 
6
990 
2017 Q1
11
857 
2
580 
2016 Q4
8
882 
2
954 
2016 Q3
17
1 197 
1
462 
2016 Q2
13
1 153 
0
--- 
2016 Q1
12
1 012 
2
789 
2015 Q4
20
1 294 
3
864 
2015 Q3
12
1 116 
1
1 034 
2015 Q2
11
1 265 
2
836 
2015 Q1
4
1 014 
1
1 339 
2014 Q4
9
1 364 
1
1 603 
2014 Q3
7
1 465 
1
1 113 
2014 Q2
8
1 234 
0
--- 
2014 Q1
4
1 180 
1
513 

Overview of the latest real estate transactions

The following list is an anonymized overview of the latest transactions. For more details and to find all transactions, please use the map to view transactions by plot or the transaction search page for a search by criteria.

2025-06-24
52 892 
Sale
Land
44077 m2
-Terres
2025-06-23
57 500 
1 223  /m²(47 m²)
Sale
Apartments
Apartment
2 rooms
47 m2
1 outbuilding
2025-06-19
40 000 
182  /m²(220 m²)
Sale
Commercial property
220 m2
Land
109 m2
-Sols
2025-06-05
10 000 
Sale
Land
377 m2
-Jardins
/Jardin potager
2025-06-04
83 900 
1 311  /m²(64 m²)
Sale
Apartments
Apartment
3 rooms
64 m2
1 outbuilding
2025-05-27
50 000 
481  /m²(104 m²)
Sale
Houses
House
5 rooms
104 m2
Land
943 m2
-Sols
2025-05-27
10 000 
Sale
Land
3157 m2
-Landes
/Pacage
2025-05-23
89 000 
2 342  /m²(38 m²)
Sale
Houses
House
2 rooms
38 m2
Land
62 m2
-Sols
Land
81 m2
-Sols
2025-05-23
170 000 
955  /m²(178 m²)
Sale
Houses
House
5 rooms
108 m2
Houses
House
3 rooms
70 m2
Land
1045 m2
-Sols
Land
217 m2
-Sols
2025-05-15
429 900 
1 493  /m²(288 m²)
1 604  /m²(268 m²)
Sale
Houses
House
6 rooms
268 m2
Commercial property
20 m2
Land
193 m2
-Sols
Land
2 m2
-Jardins
/Jardin potager
Land
459 m2
-Jardins
/Jardin potager
Land
153 m2
-Jardins
/Jardin potager
2025-05-15
132 900 
1 038  /m²(128 m²)
Sale
Apartments
Apartment
3 rooms
56 m2
Apartments
Apartment
2 rooms
37 m2
Apartments
Apartment
2 rooms
35 m2
3 outbuildings
2025-05-14
124 340 
1 498  /m²(83 m²)
Sale
Houses
House
4 rooms
83 m2
2 outbuildings
Land
561 m2
-Sols
2025-05-13
52 900 
1 058  /m²(50 m²)
Sale
Apartments
Apartment
2 rooms
50 m2
1 outbuilding
2025-05-06
142 000 
1 449  /m²(98 m²)
Sale
Houses
House
4 rooms
98 m2
Land
728 m2
-Sols
2025-05-02
86 500 
856  /m²(101 m²)
Sale
Houses
House
4 rooms
101 m2
1 outbuilding
Land
572 m2
-Sols
2025-04-25
25 578 
Sale
Land
3654 m2
-Terres
2025-04-25
236 885 
2 235  /m²(106 m²)
Sale
Houses
House
4 rooms
106 m2
Land
1784 m2
-Sols
Land
3315 m2
-Terrains d'agrément
/Parc
Land
1500 m2
-Vergers
/Pommiers
2025-04-25
25 000 
Sale
Land
730 m2
-Terrains à bâtir
2025-04-25
219 200 
2 357  /m²(93 m²)
Sale
Houses
House
4 rooms
93 m2
Land
1000 m2
-Sols
2025-04-24
68 570 
Sale
Land
12558 m2
-Terres
Land
56012 m2
-Terres
1103 transactions listed in the municipality

Hautes-Pyrénées (65)

Most expensive cities

City
name
Descending orderHouses
house
Price per m²
4 315 
3 974 
3 548 
3 375 
3 300 
3 216 
3 205 
3 119 
3 080 
City
name
Descending orderApartments
apt.
Price per m²
5 224 
3 906 
3 772 
3 380 
3 323 
3 321 
3 128 
3 116 
3 000 

Least expensive cities

City
name
Ascending orderHouses
house
Price per m²
508 
536 
566 
571 
642 
654 
674 
676 
City
name
Ascending orderApartments
apt.
Price per m²
76 
224 
333 
341 
370 
462 
500 
502