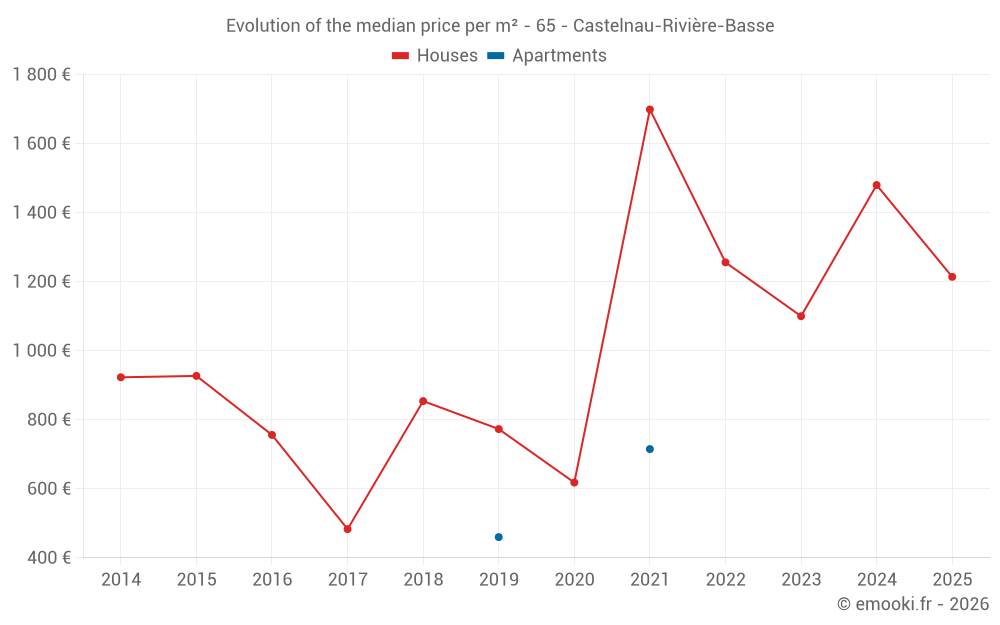
Median price of real estate
in the municipality of Castelnau-Rivière-Basse
Houses
1 163 € /m²
Reliability 6/10
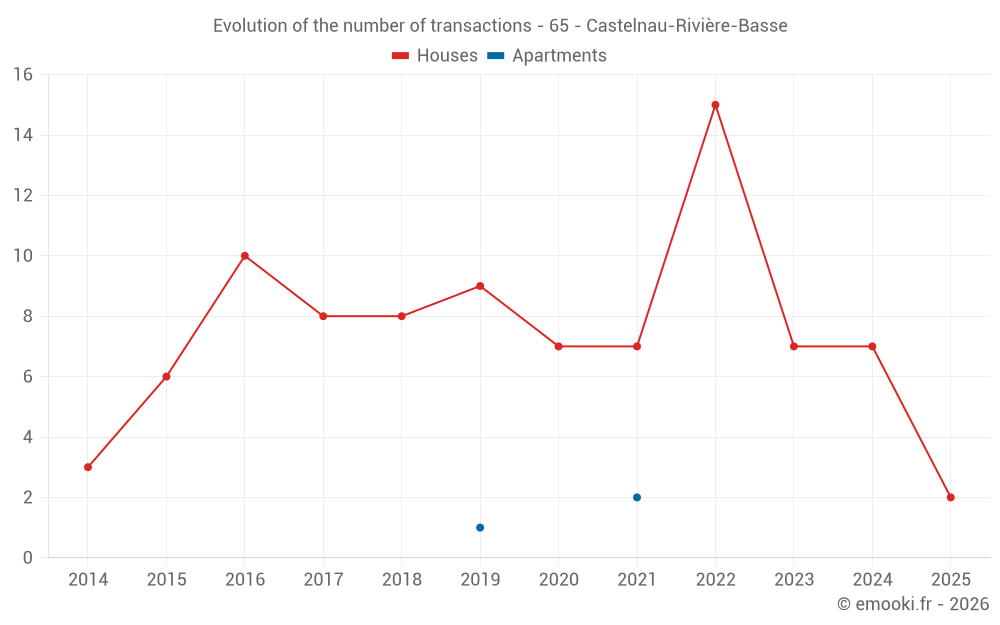
Median price on the 22 transactions of the last 36 months.
from 684 to
1 872 € /m²
1 872 € /m²
60% of transactions from the 2nd to the 8th deciles.
Apartments
623 € /m²
Reliability 1/10
Median price on the 3 transactions of the last 120 months.
Dwellings
1 163 € /m²
Reliability 6/10
Median price on the 22 transactions of the last 36 months.
from 684 to
1 872 € /m²
1 872 € /m²
60% of transactions from the 2nd to the 8th deciles.